A research desk in your pocket.
Insider trades, company financials and futures positioning, modeled from the filings on your device.
Watchlist
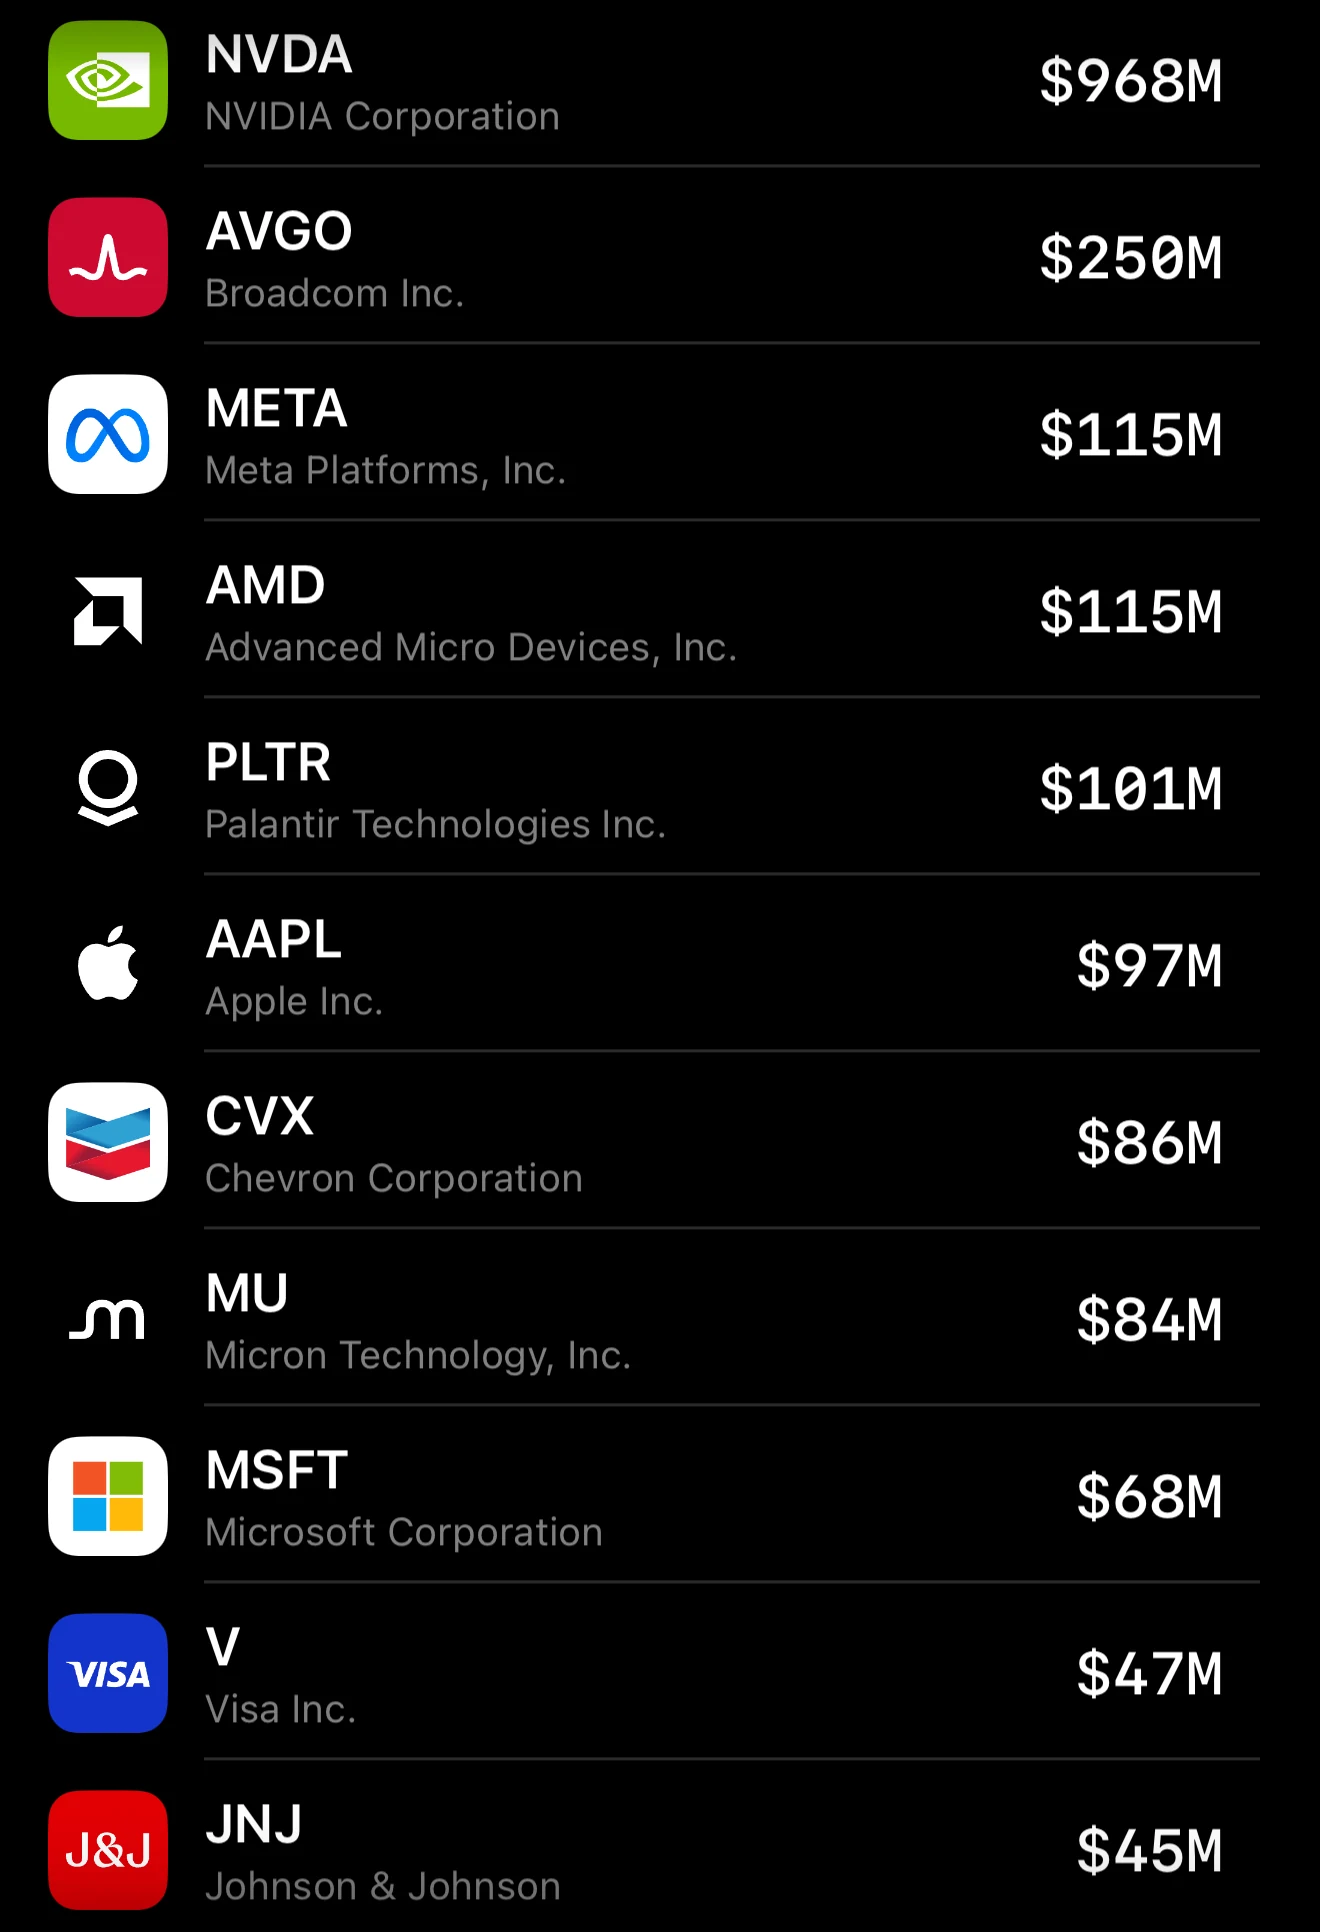
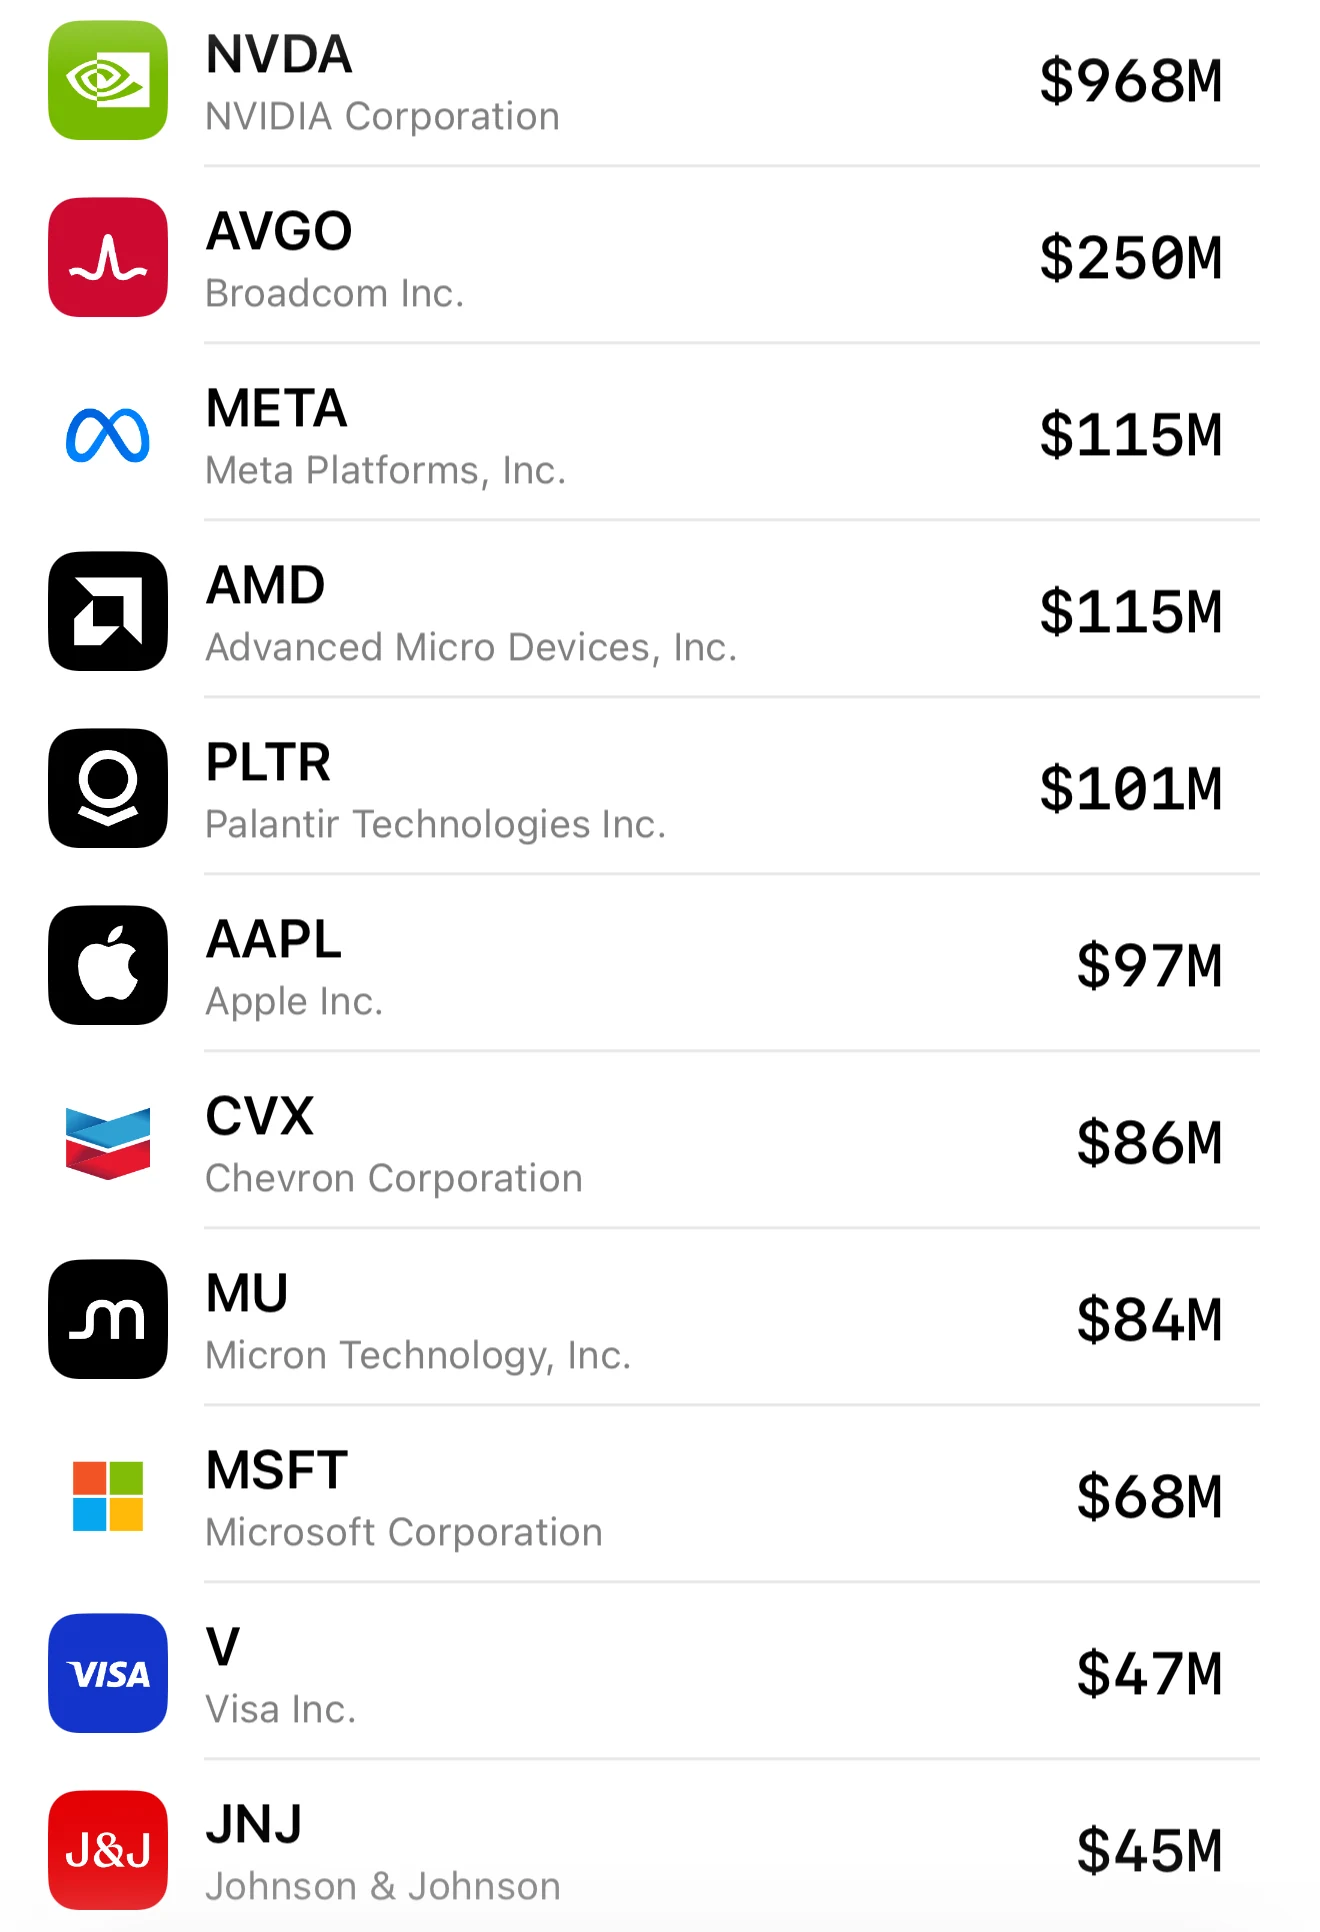
Assess insider activity across your watchlist.
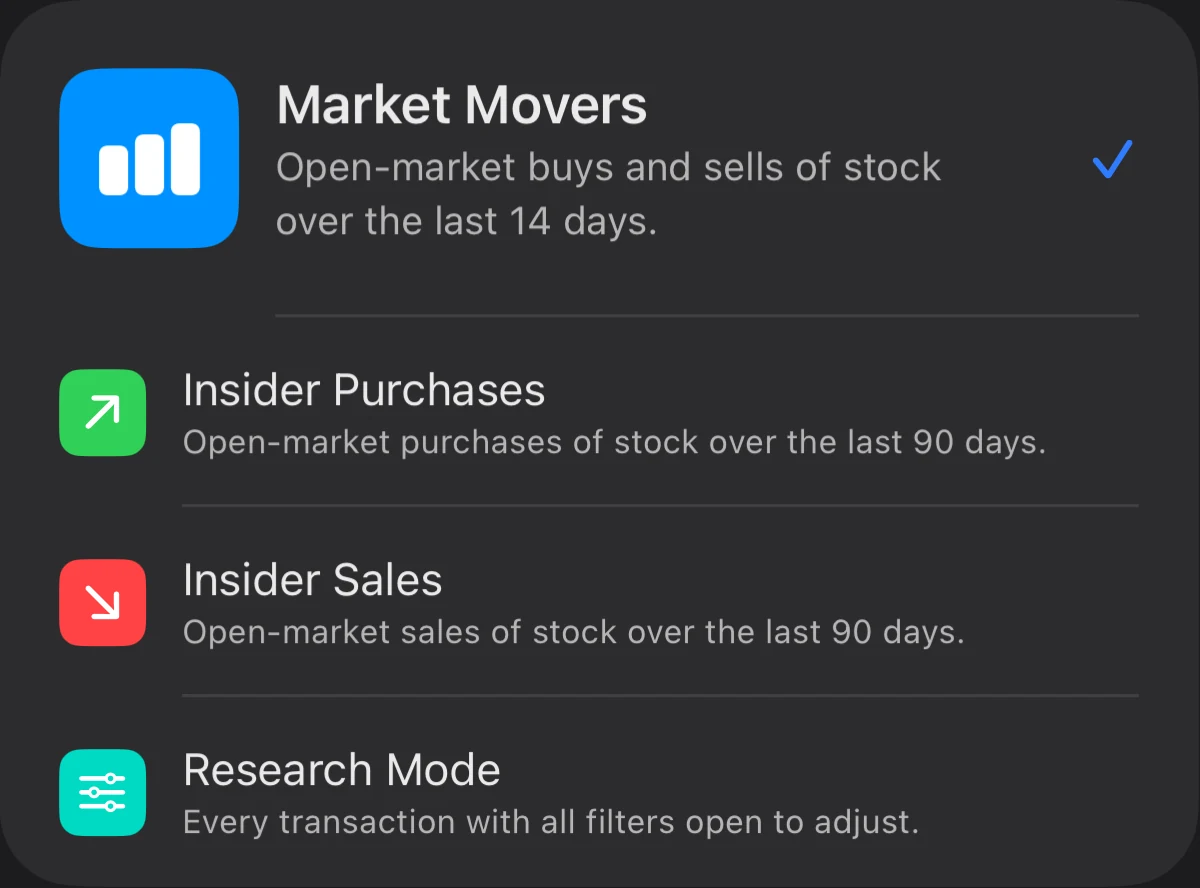
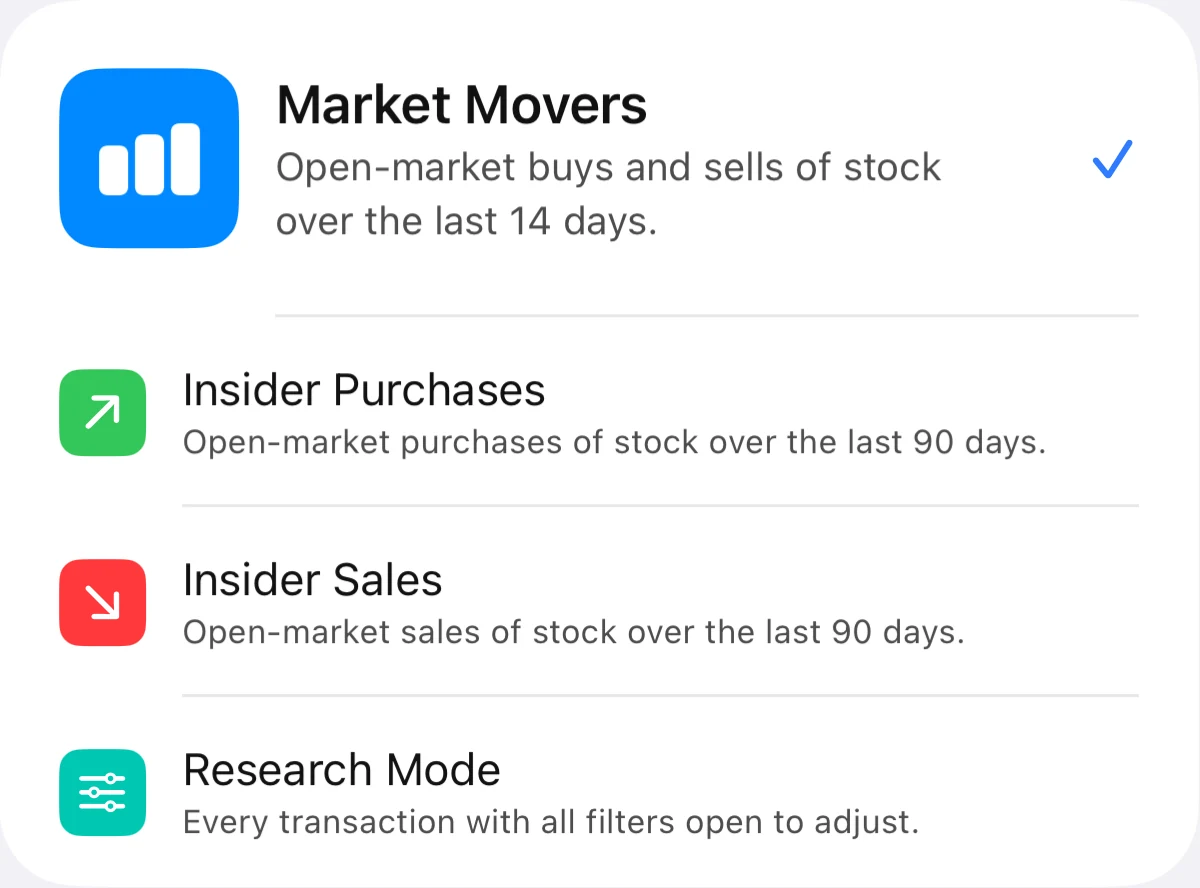
Market Movers ranks a list by open-market buying and selling over the last two weeks. Insider Purchases and Insider Sales show one side at a time over the last ninety days.
Filtering
Filter and sort trades.
Presets
Each preset applies a full configuration in one tap.
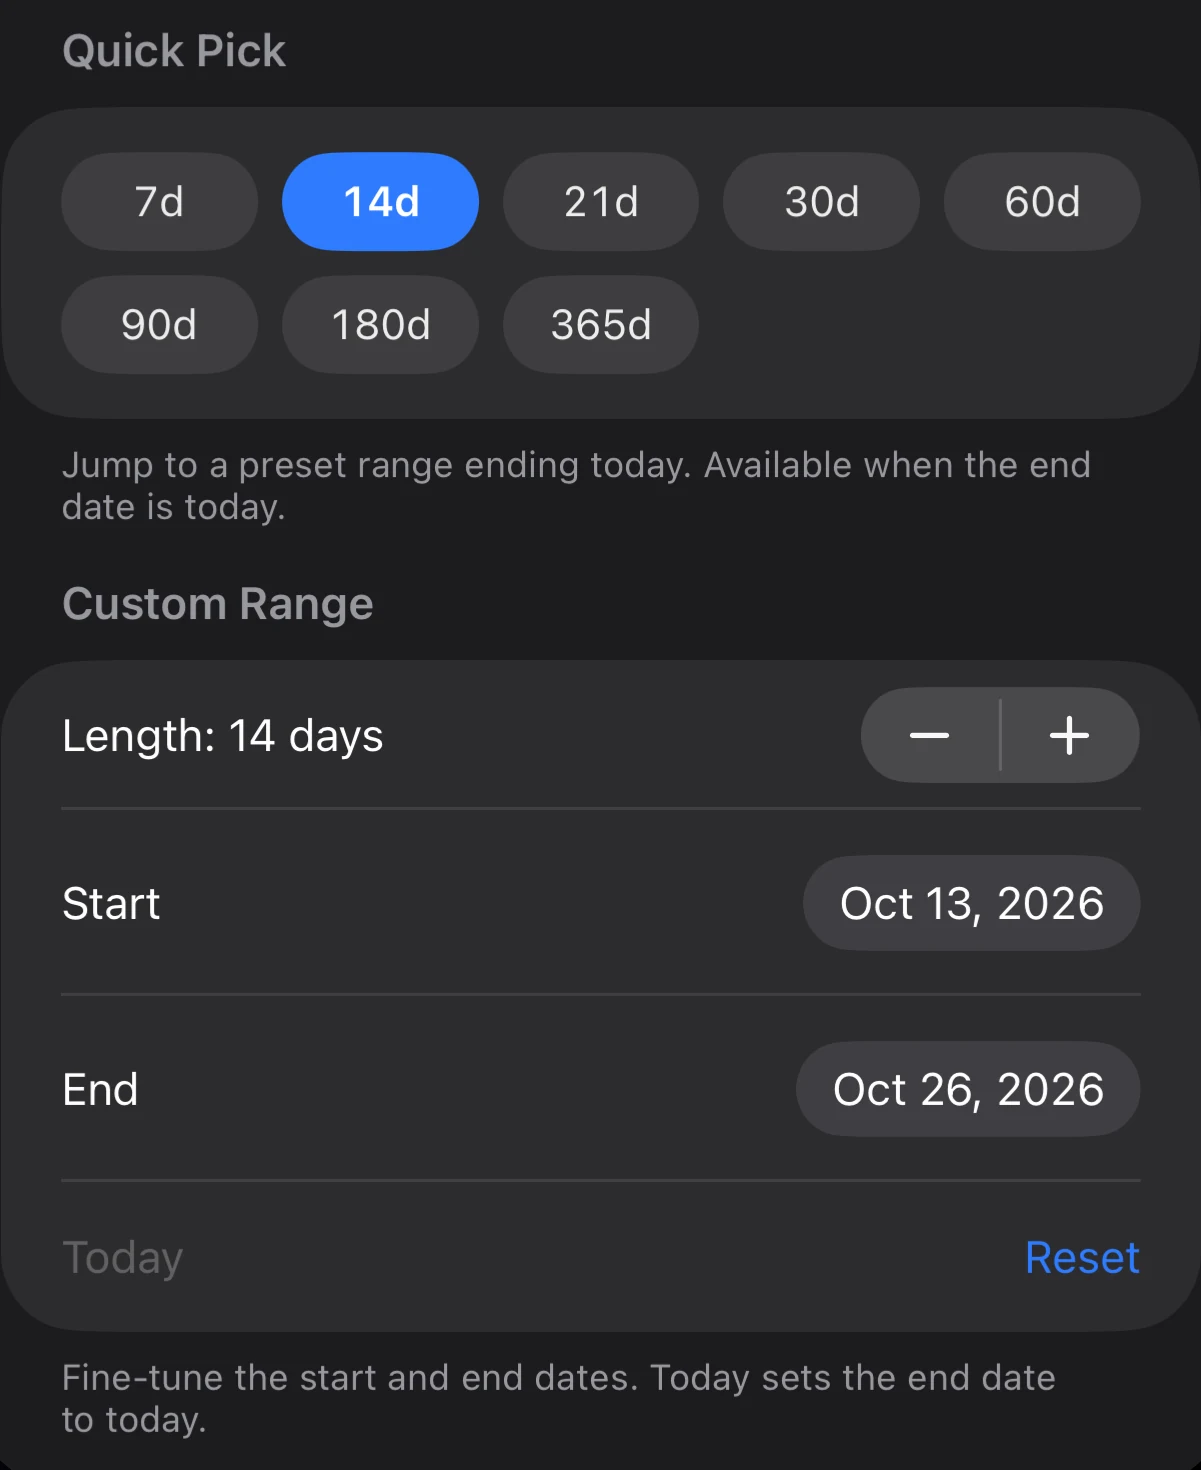
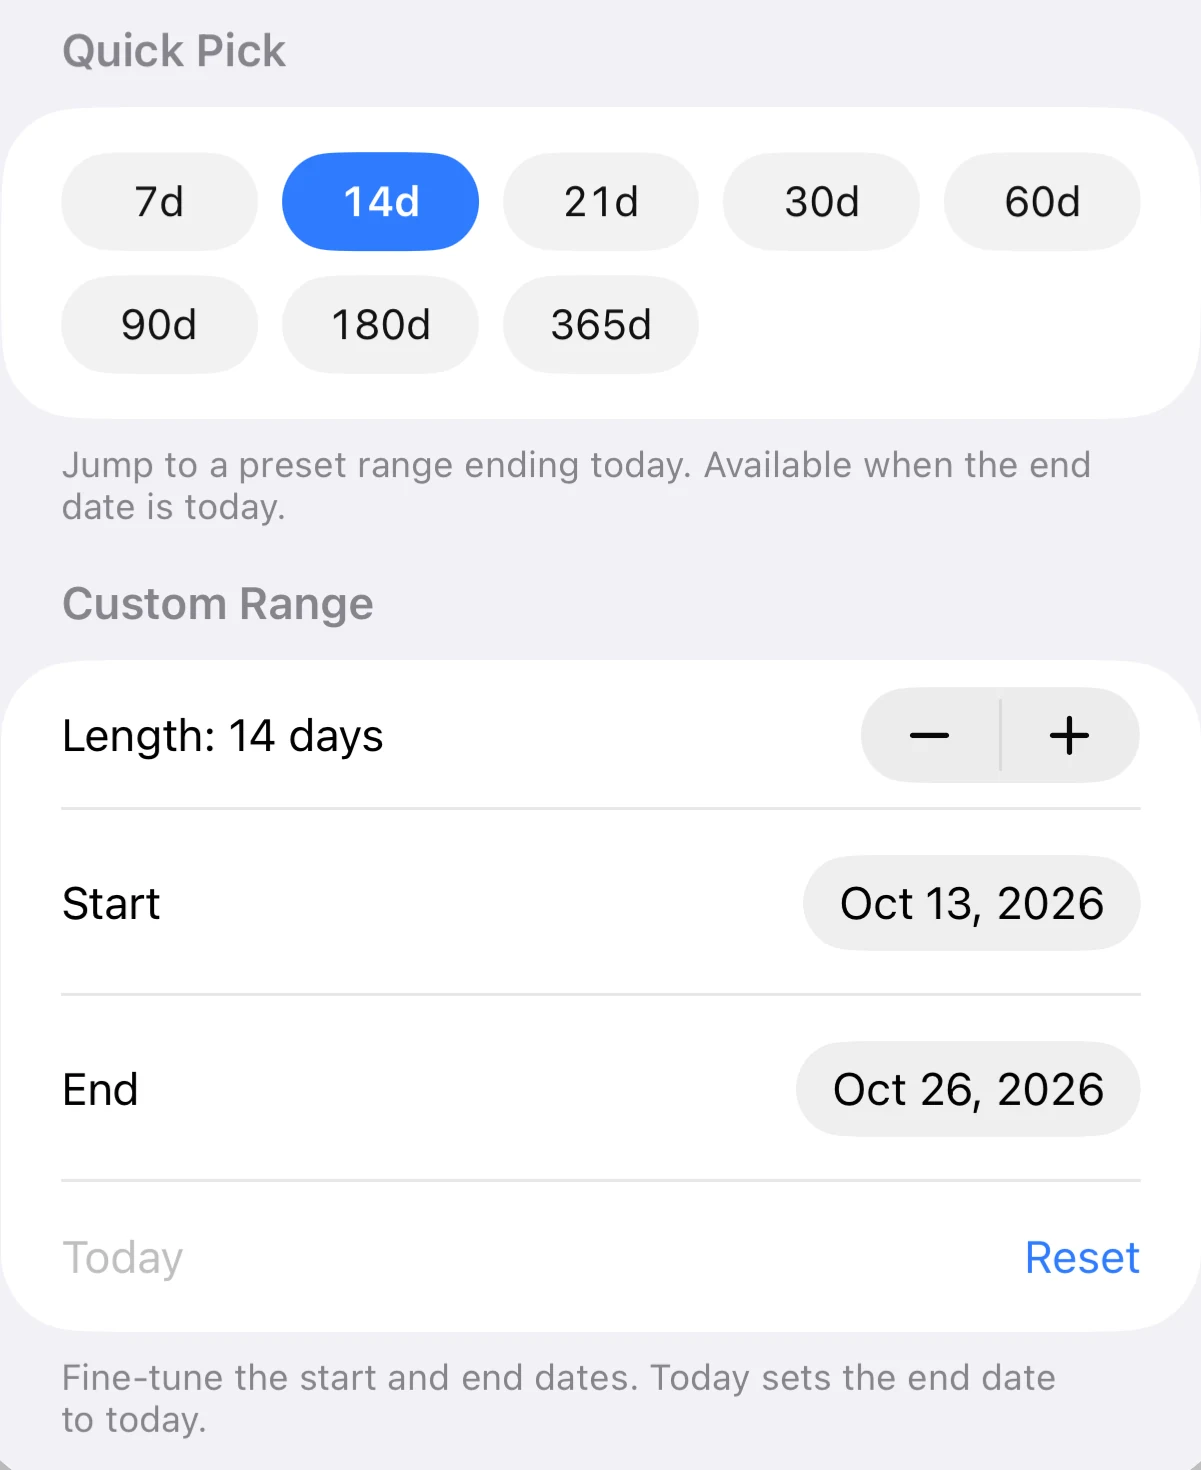
Time Range
A start and end date, quick spans from a week to a year, and a custom length.
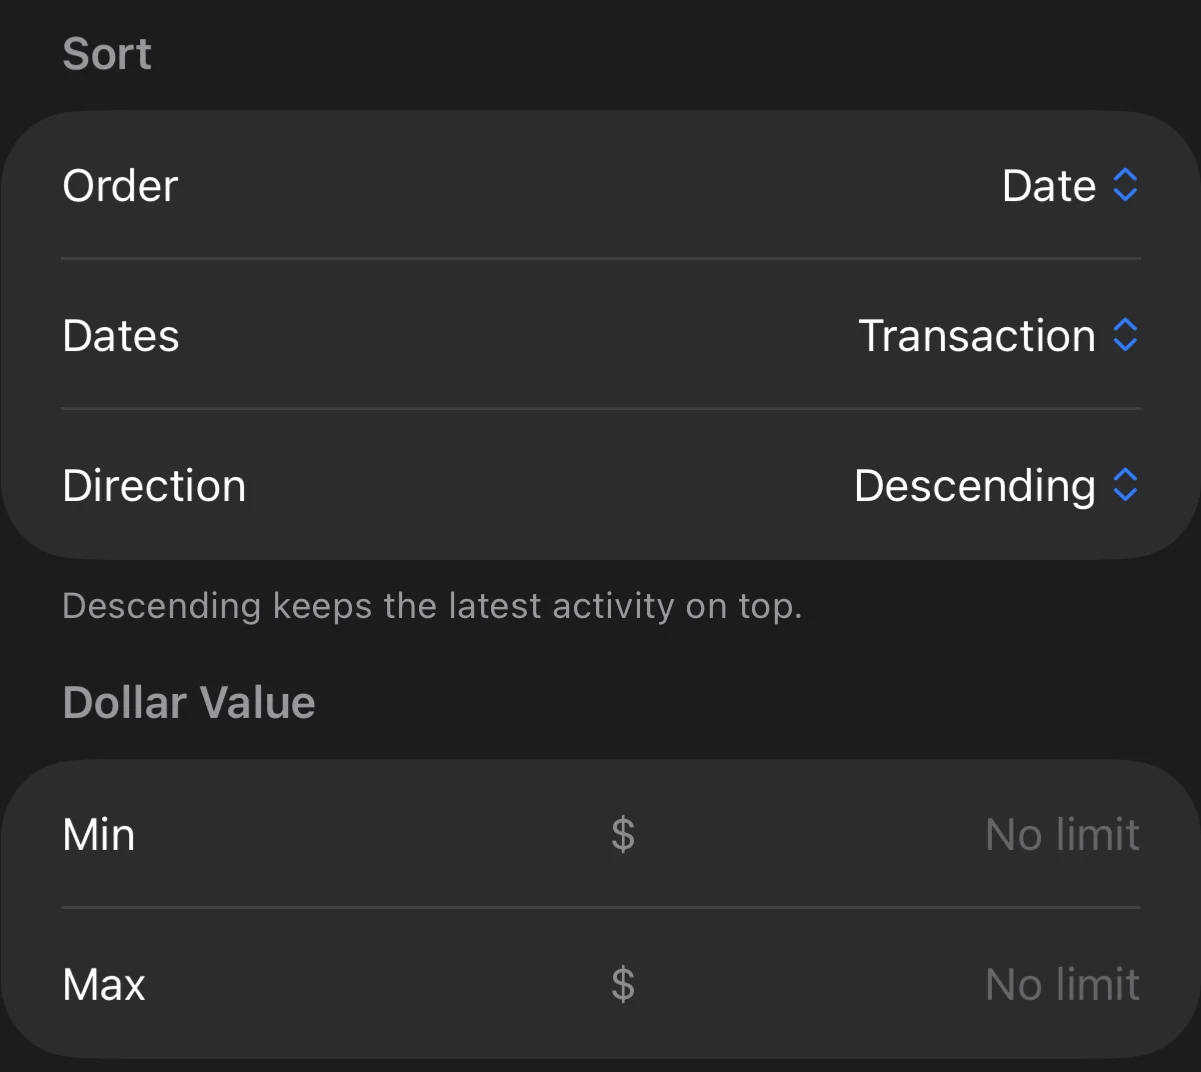
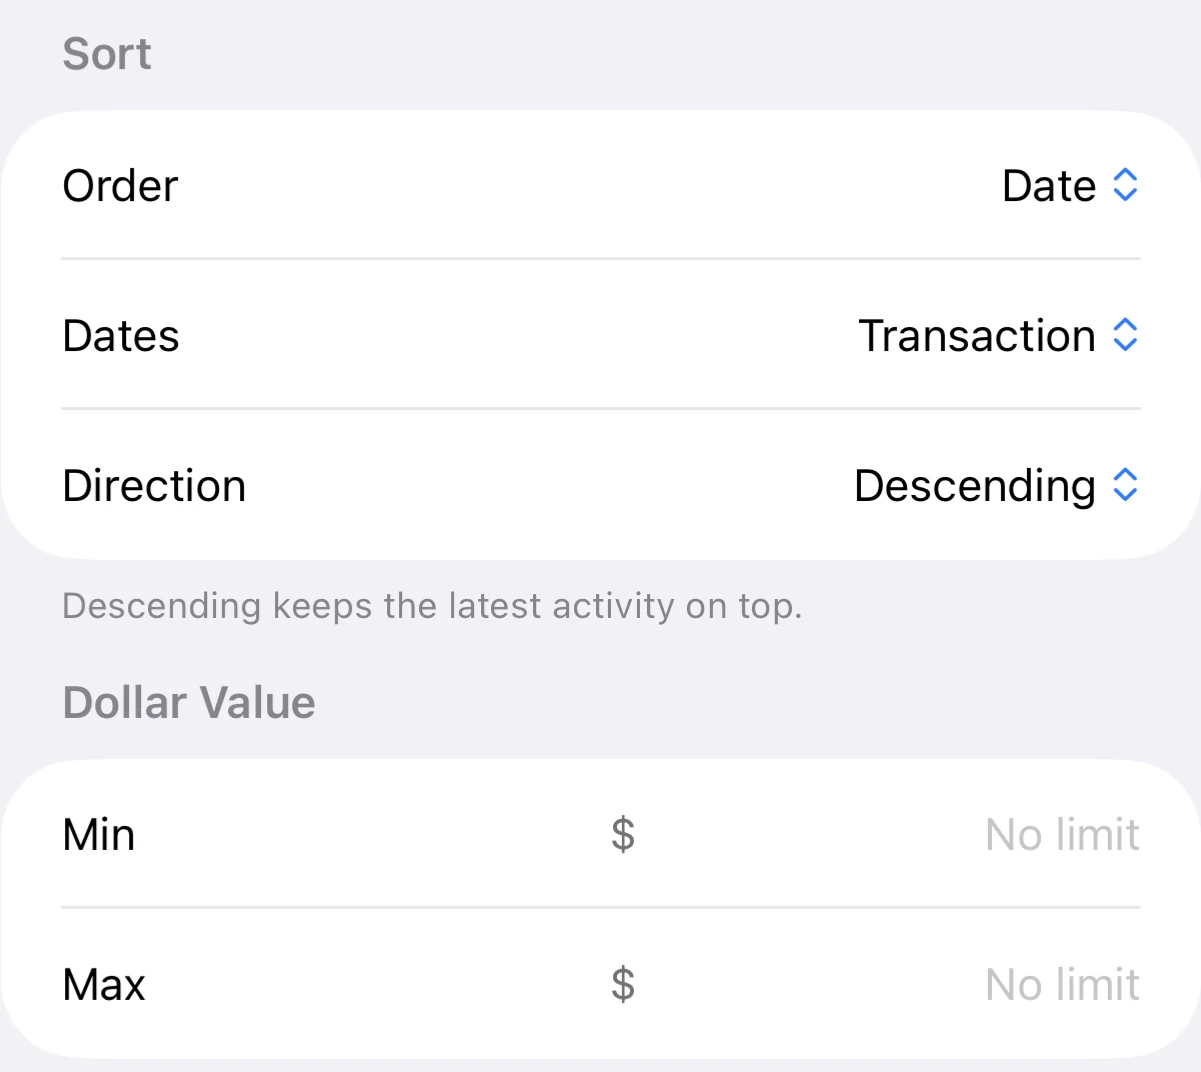
Advanced
Trades sort by date or dollar value, and filter by dollar size.
The Analytics Sheet
See the performance behind the price.
Graded statements, ratings and models from years of filings.
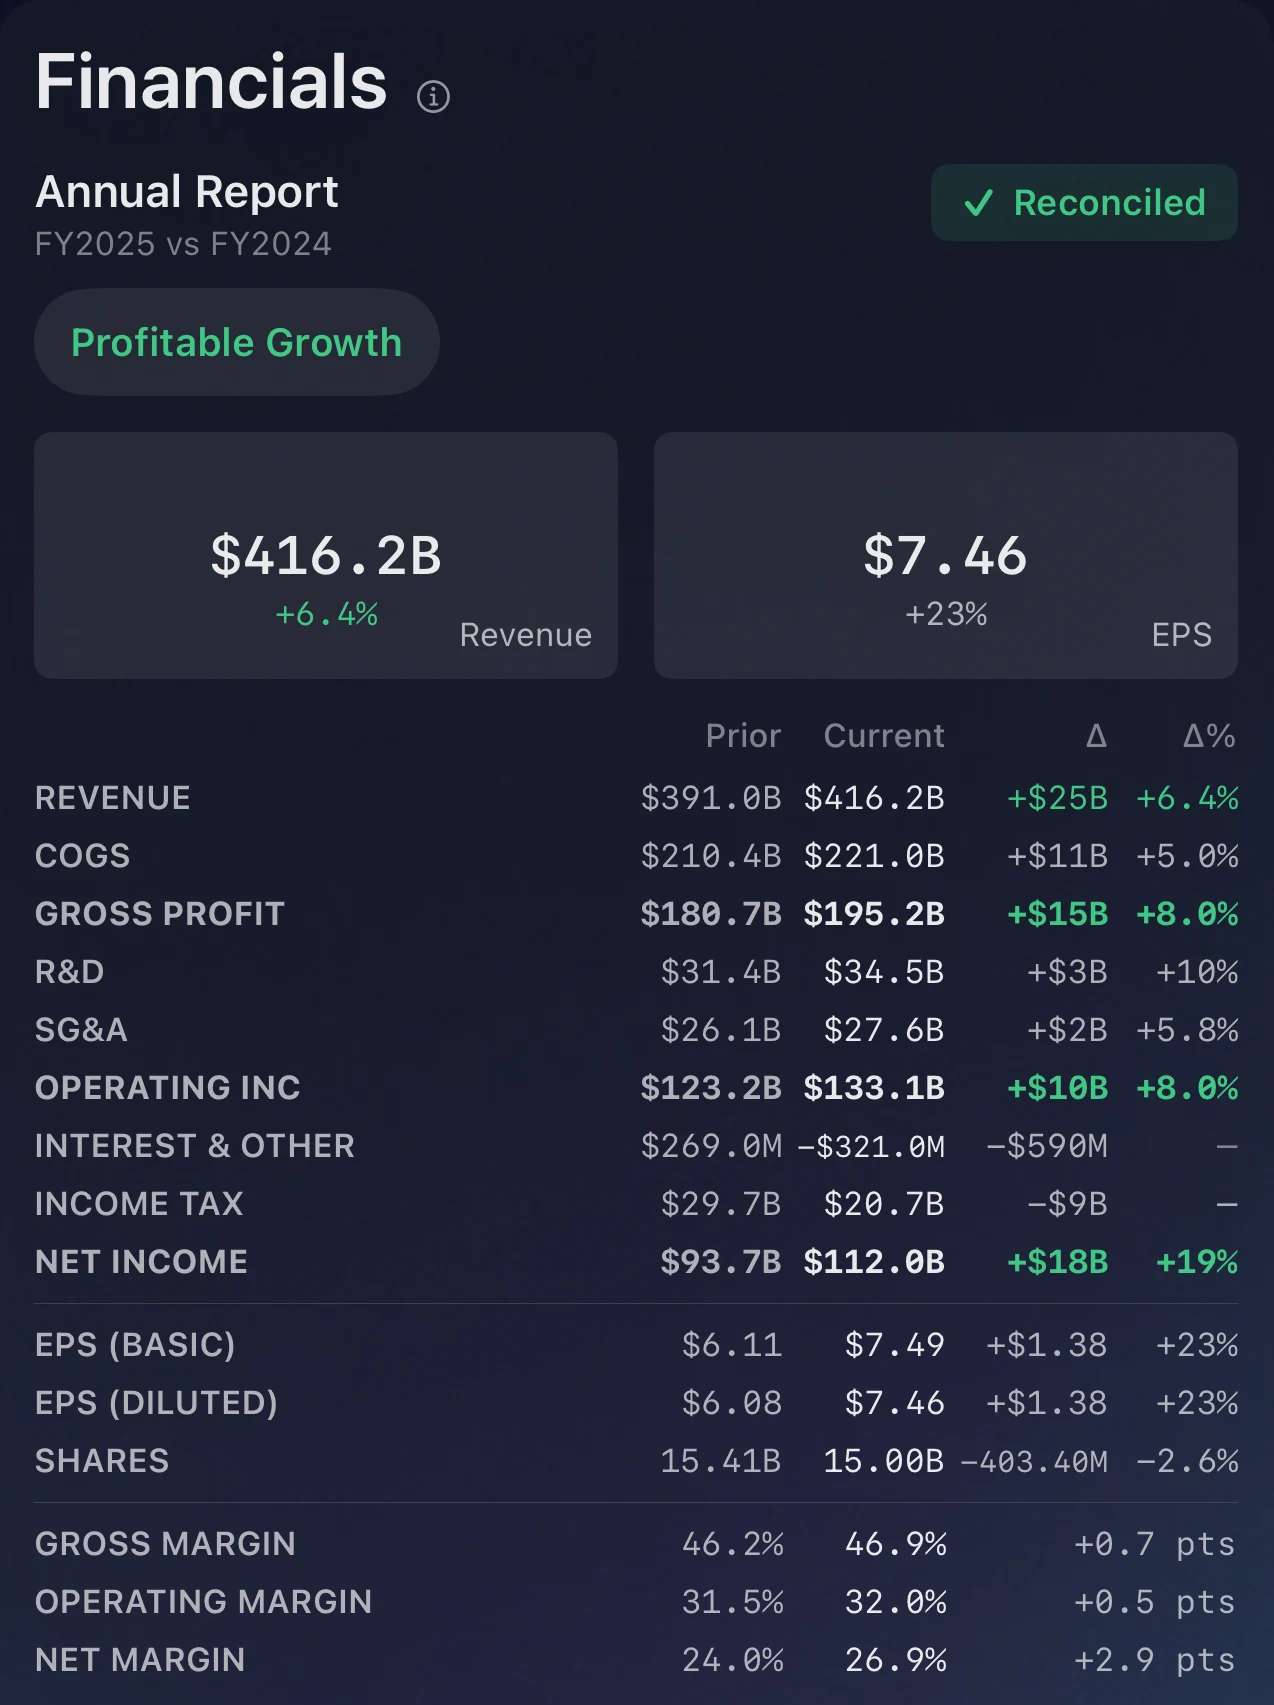
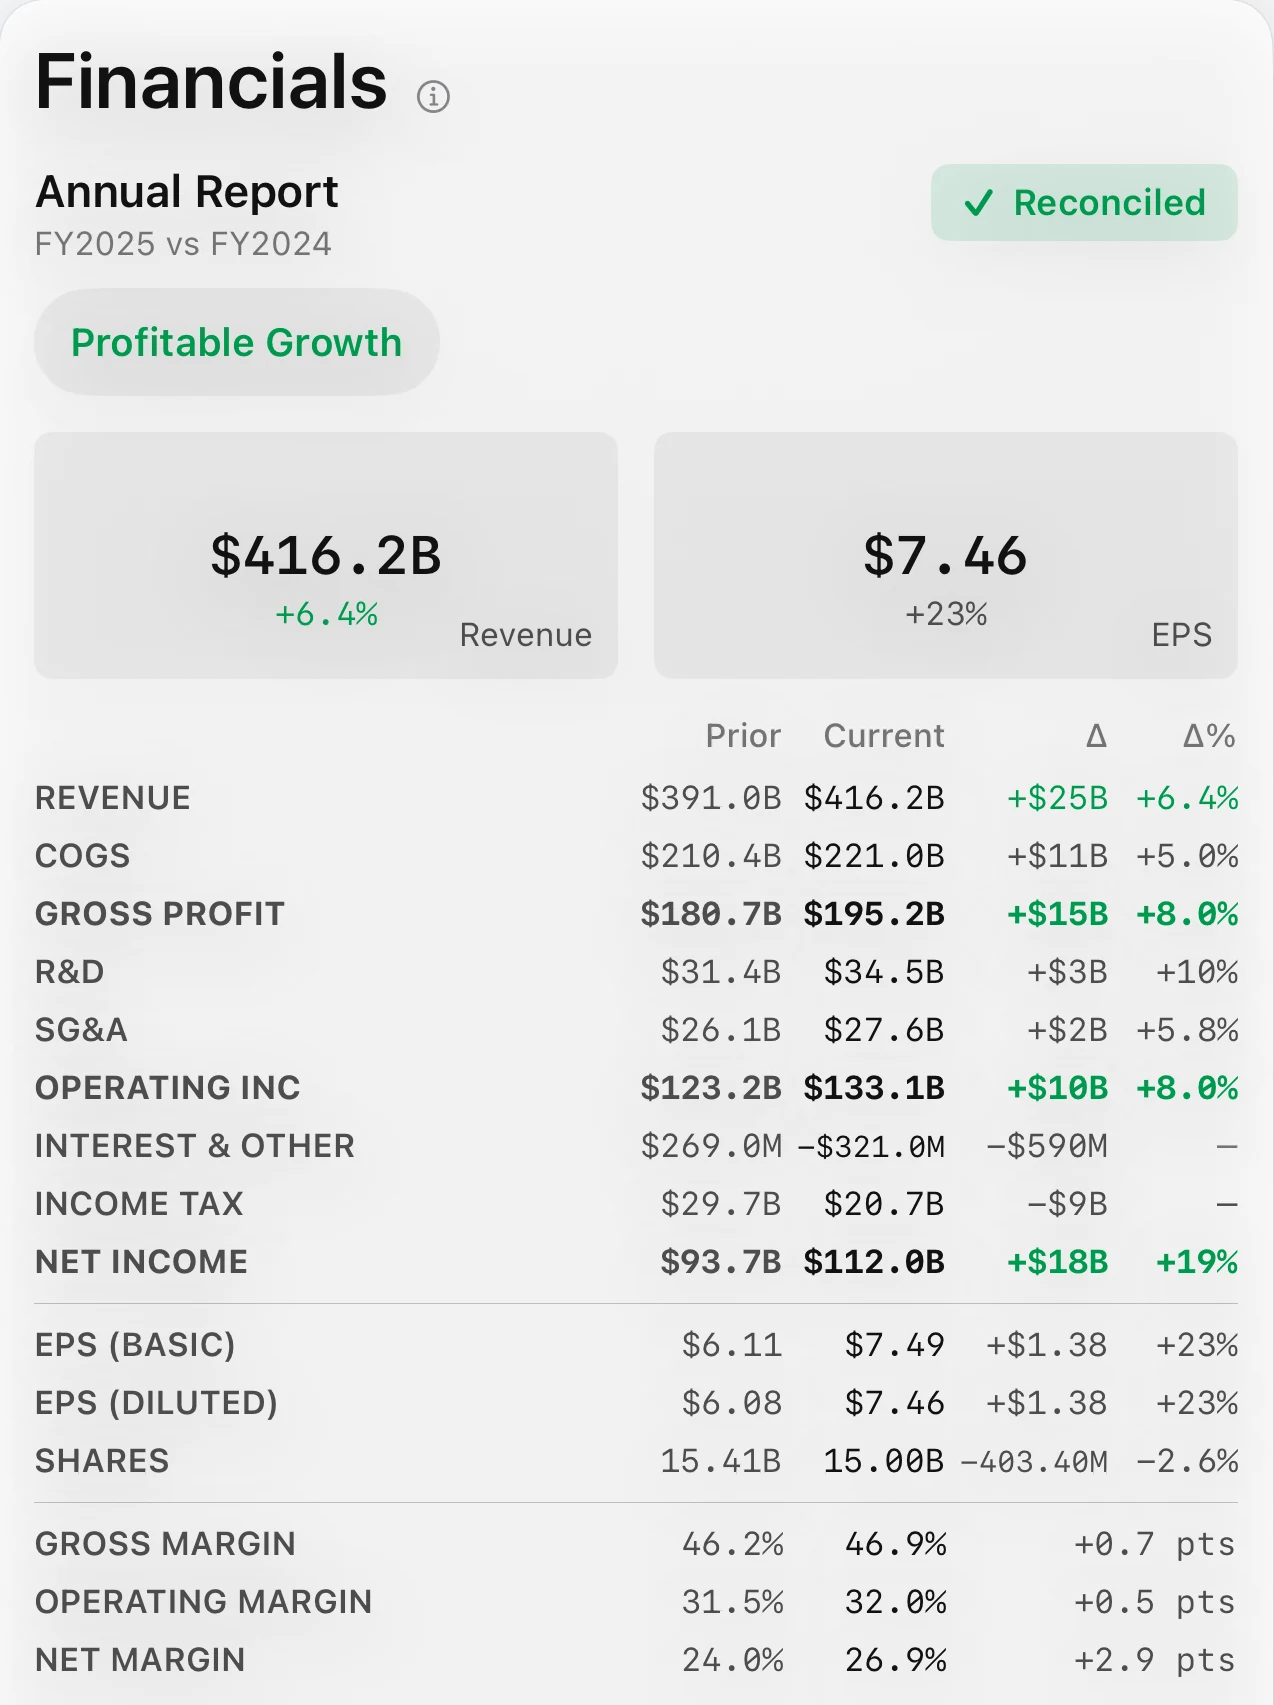
Financial statements
Growth rates on one basis.
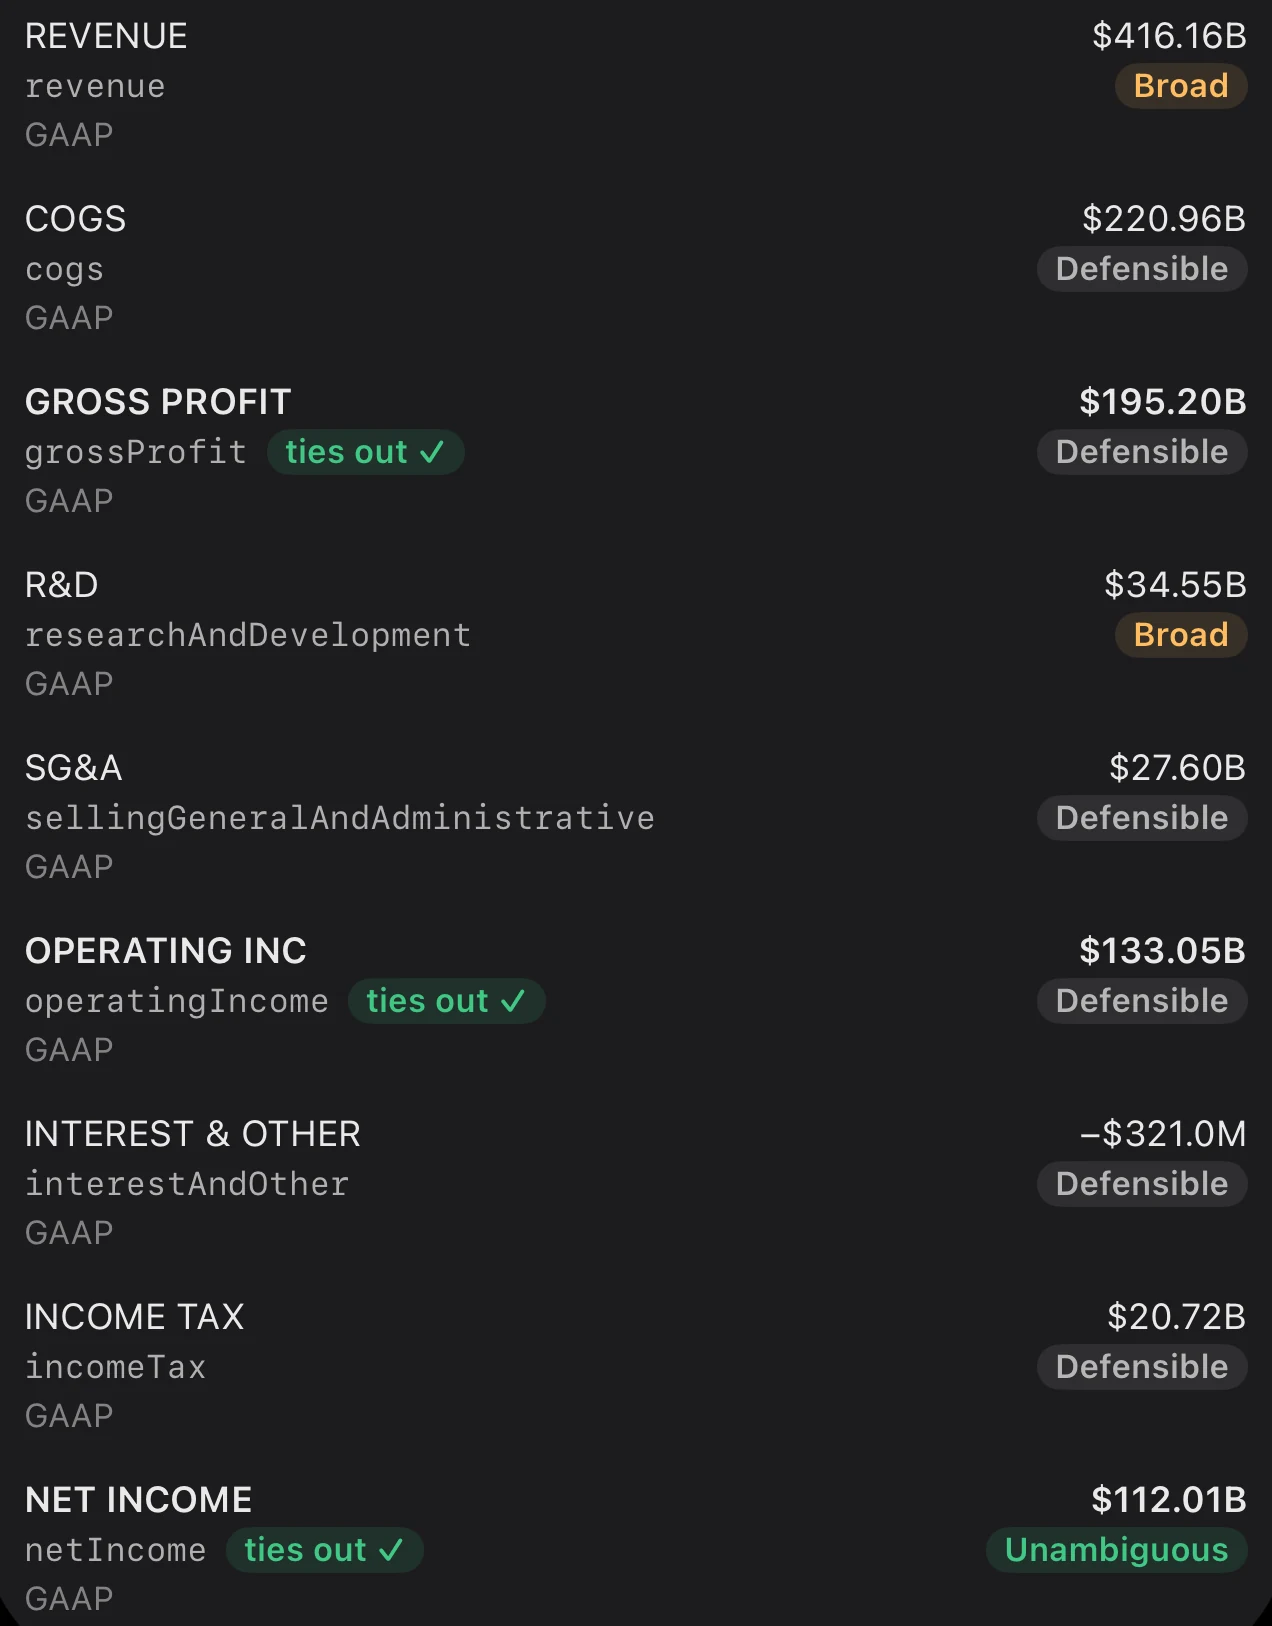
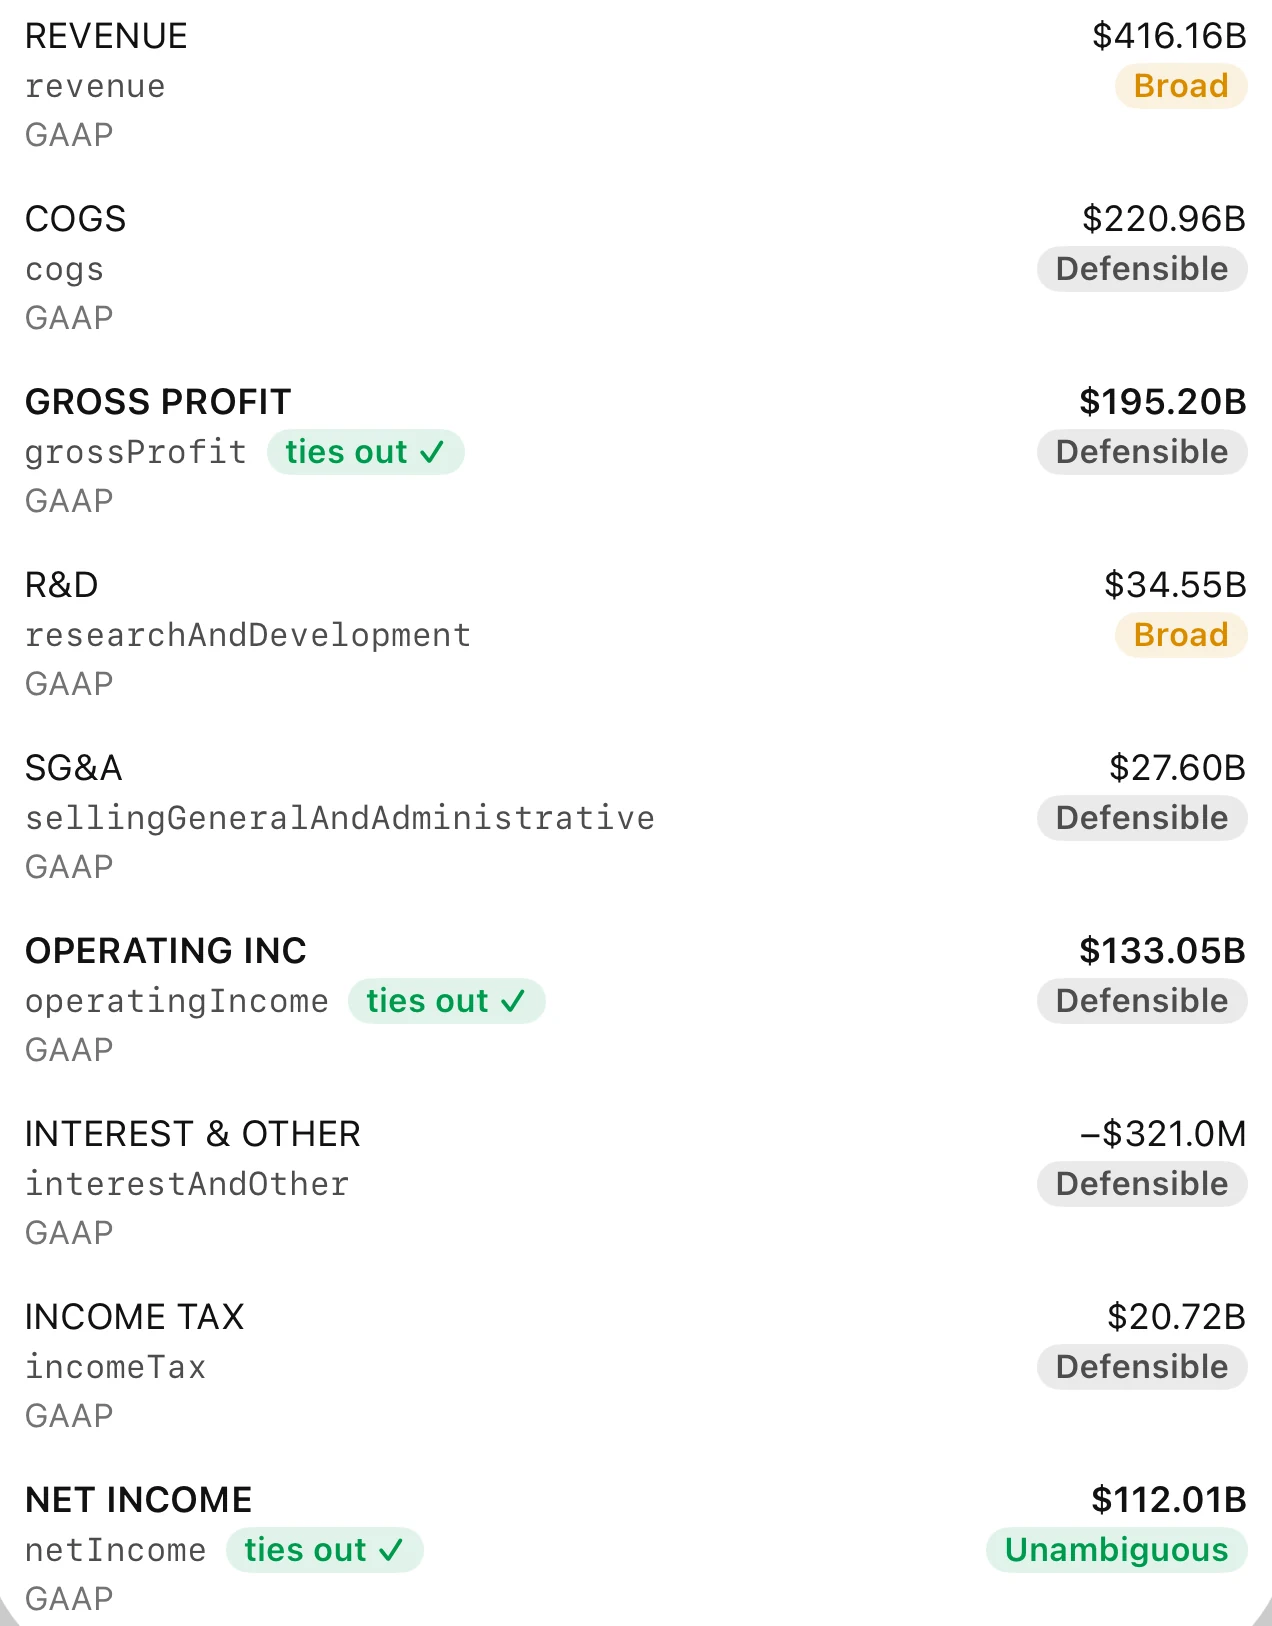
Data Quality
Figures graded for fidelity. A derived figure is marked as derived.
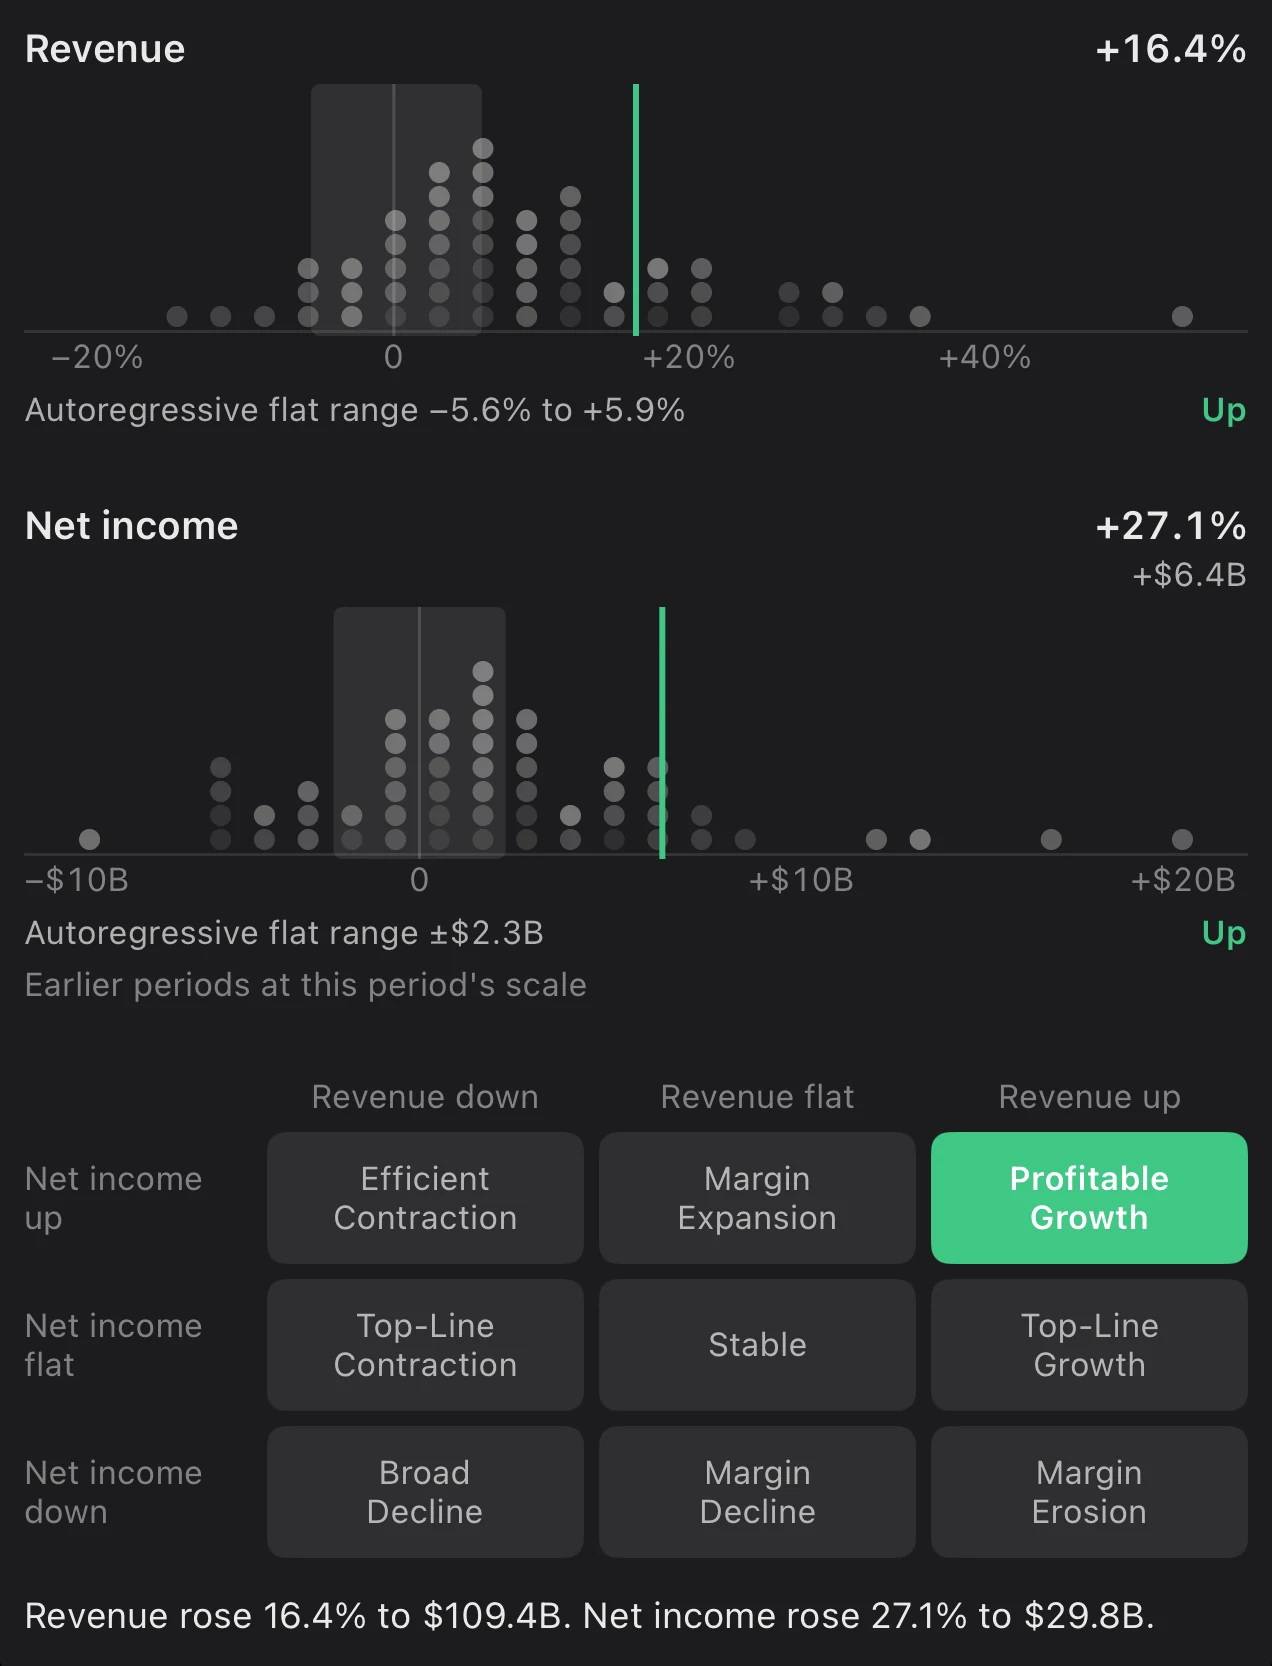
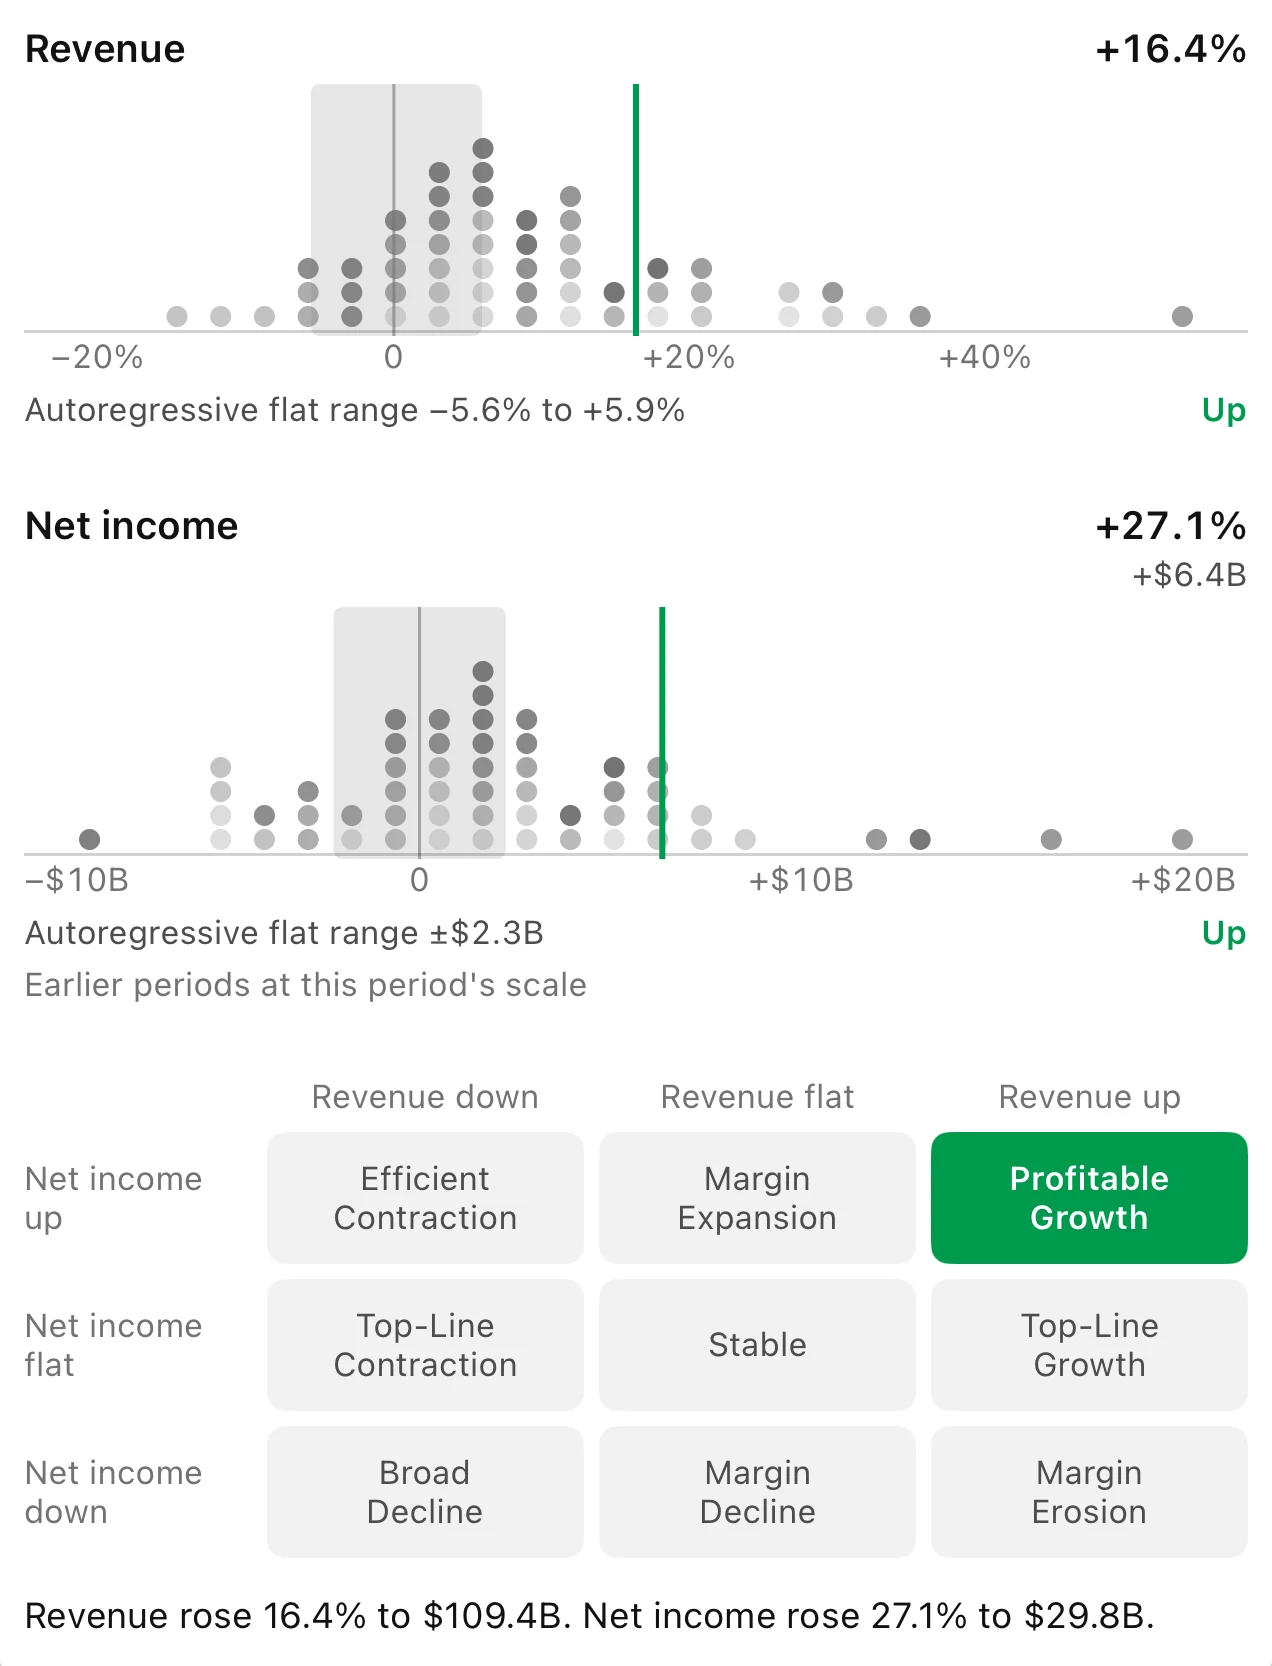
Growth-Profit Rating
Revenue and net income set against their own range, placed on one grid.
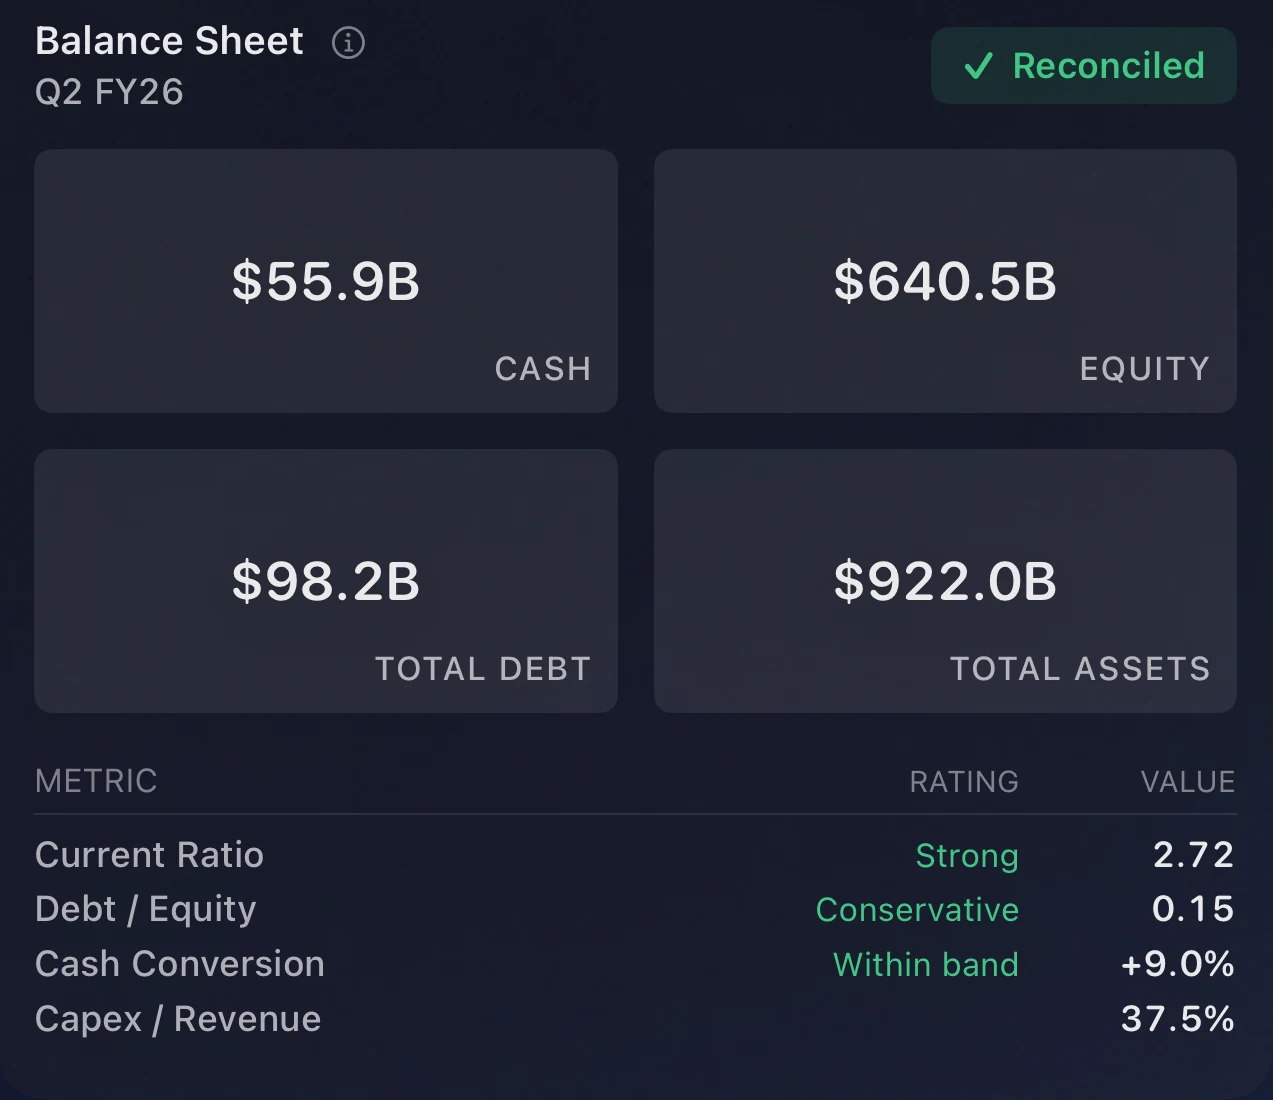
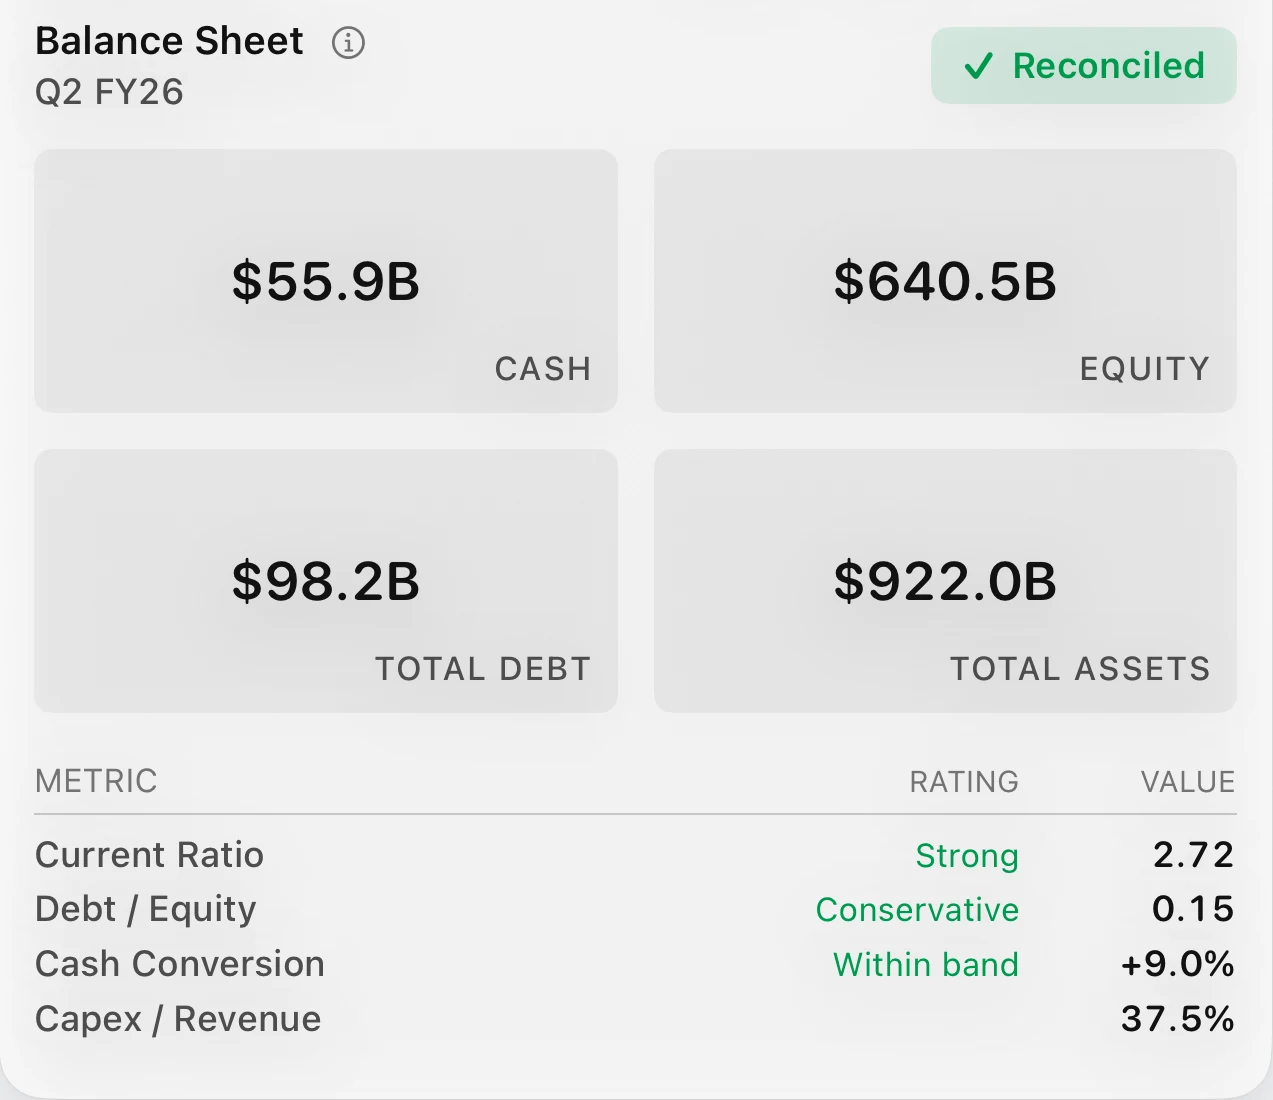
Balance sheet
Cash, equity, debt and total assets, reconciled, with the strength ratios beneath.
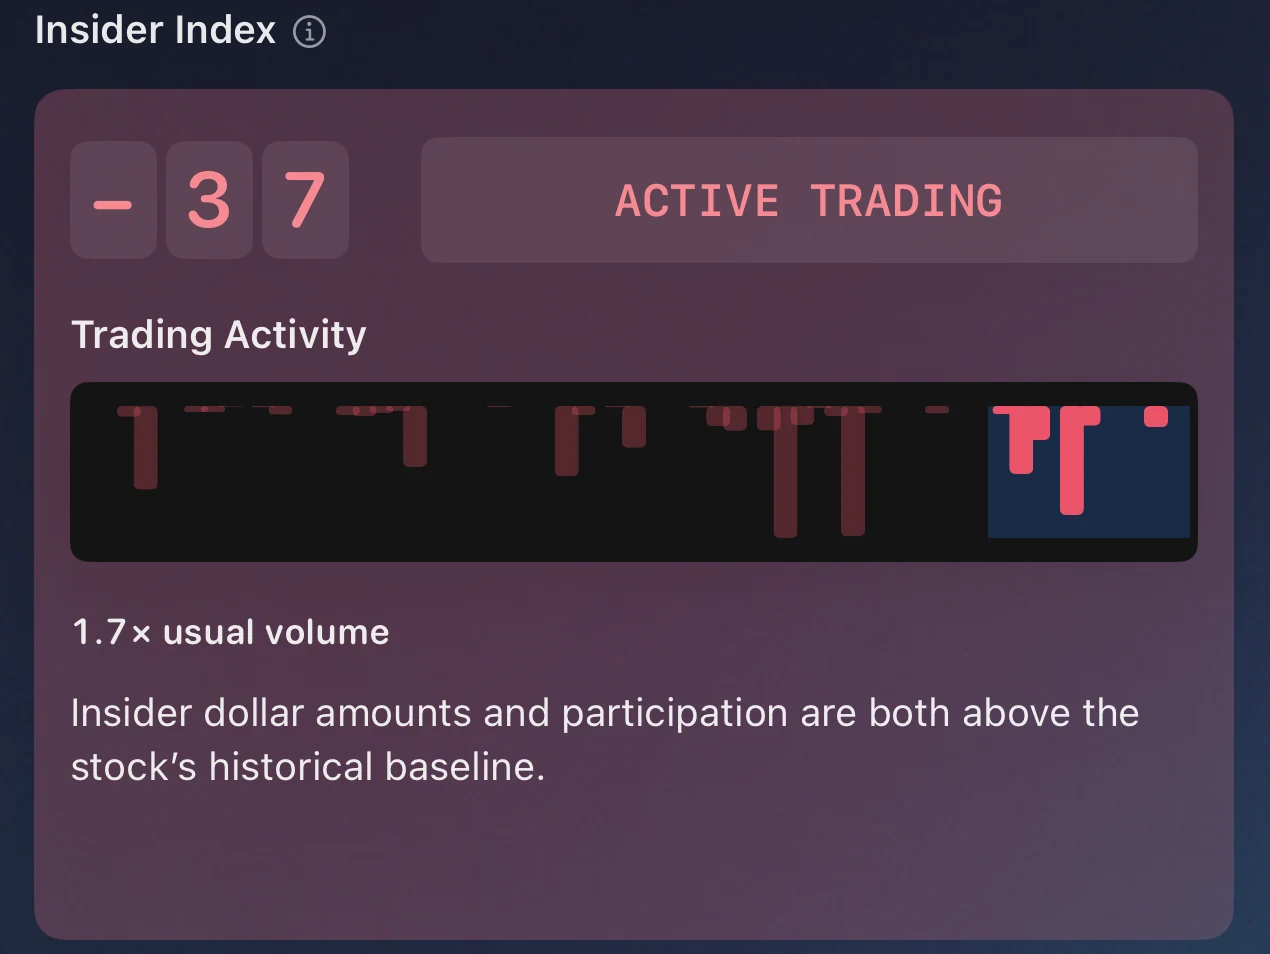
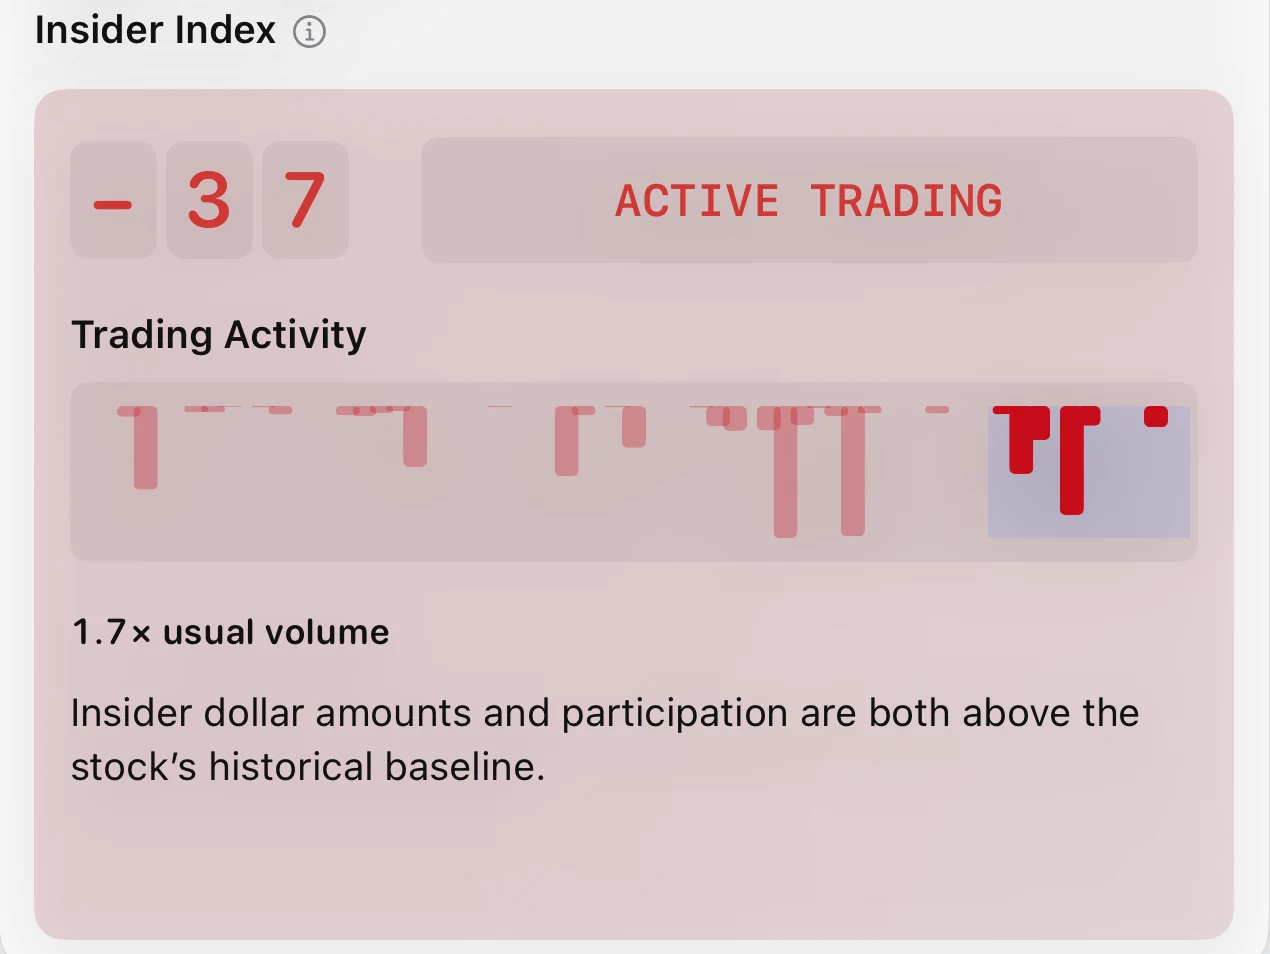
Insider Index
A score from −100 to +100 for how unusual recent insider trading is against the company’s own history.
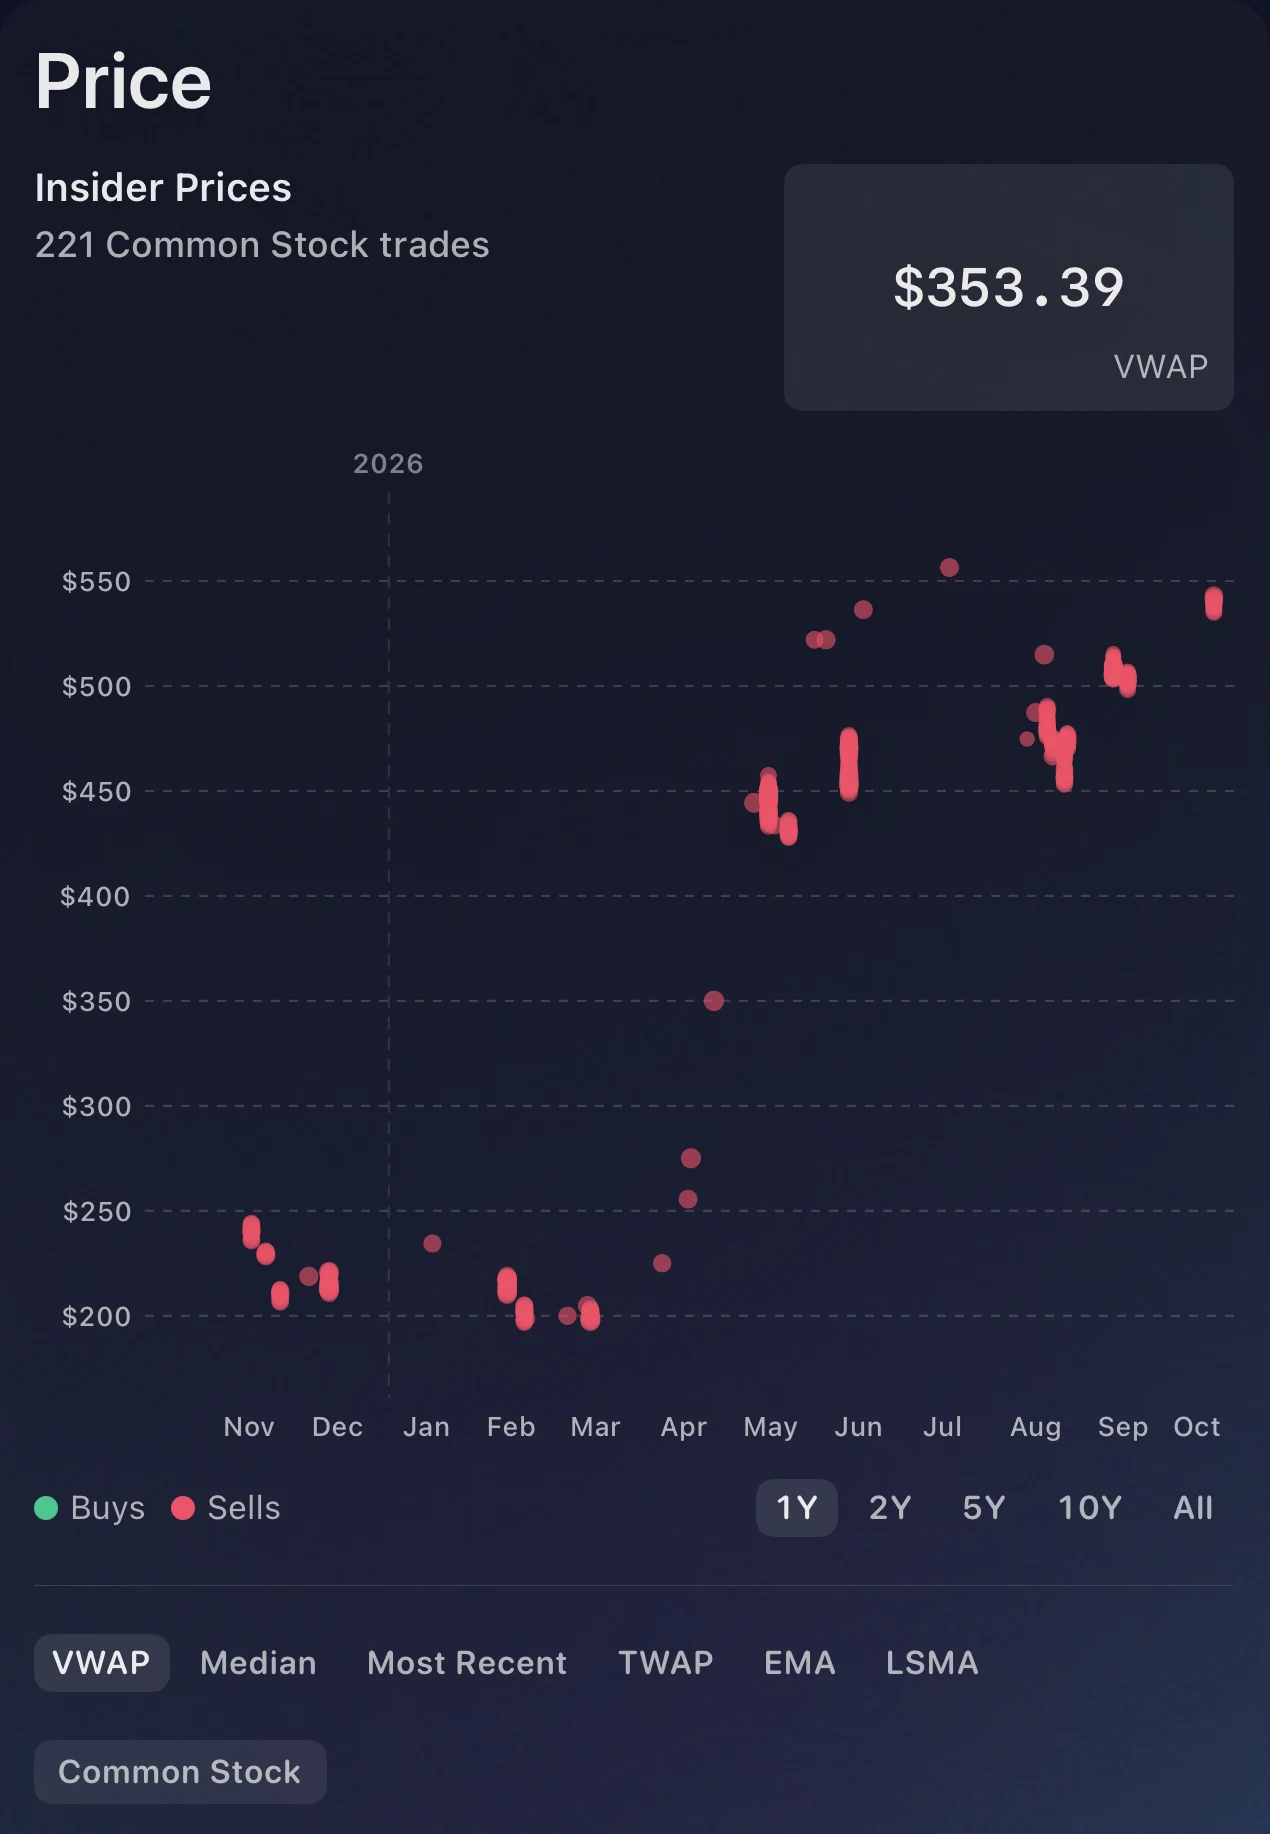
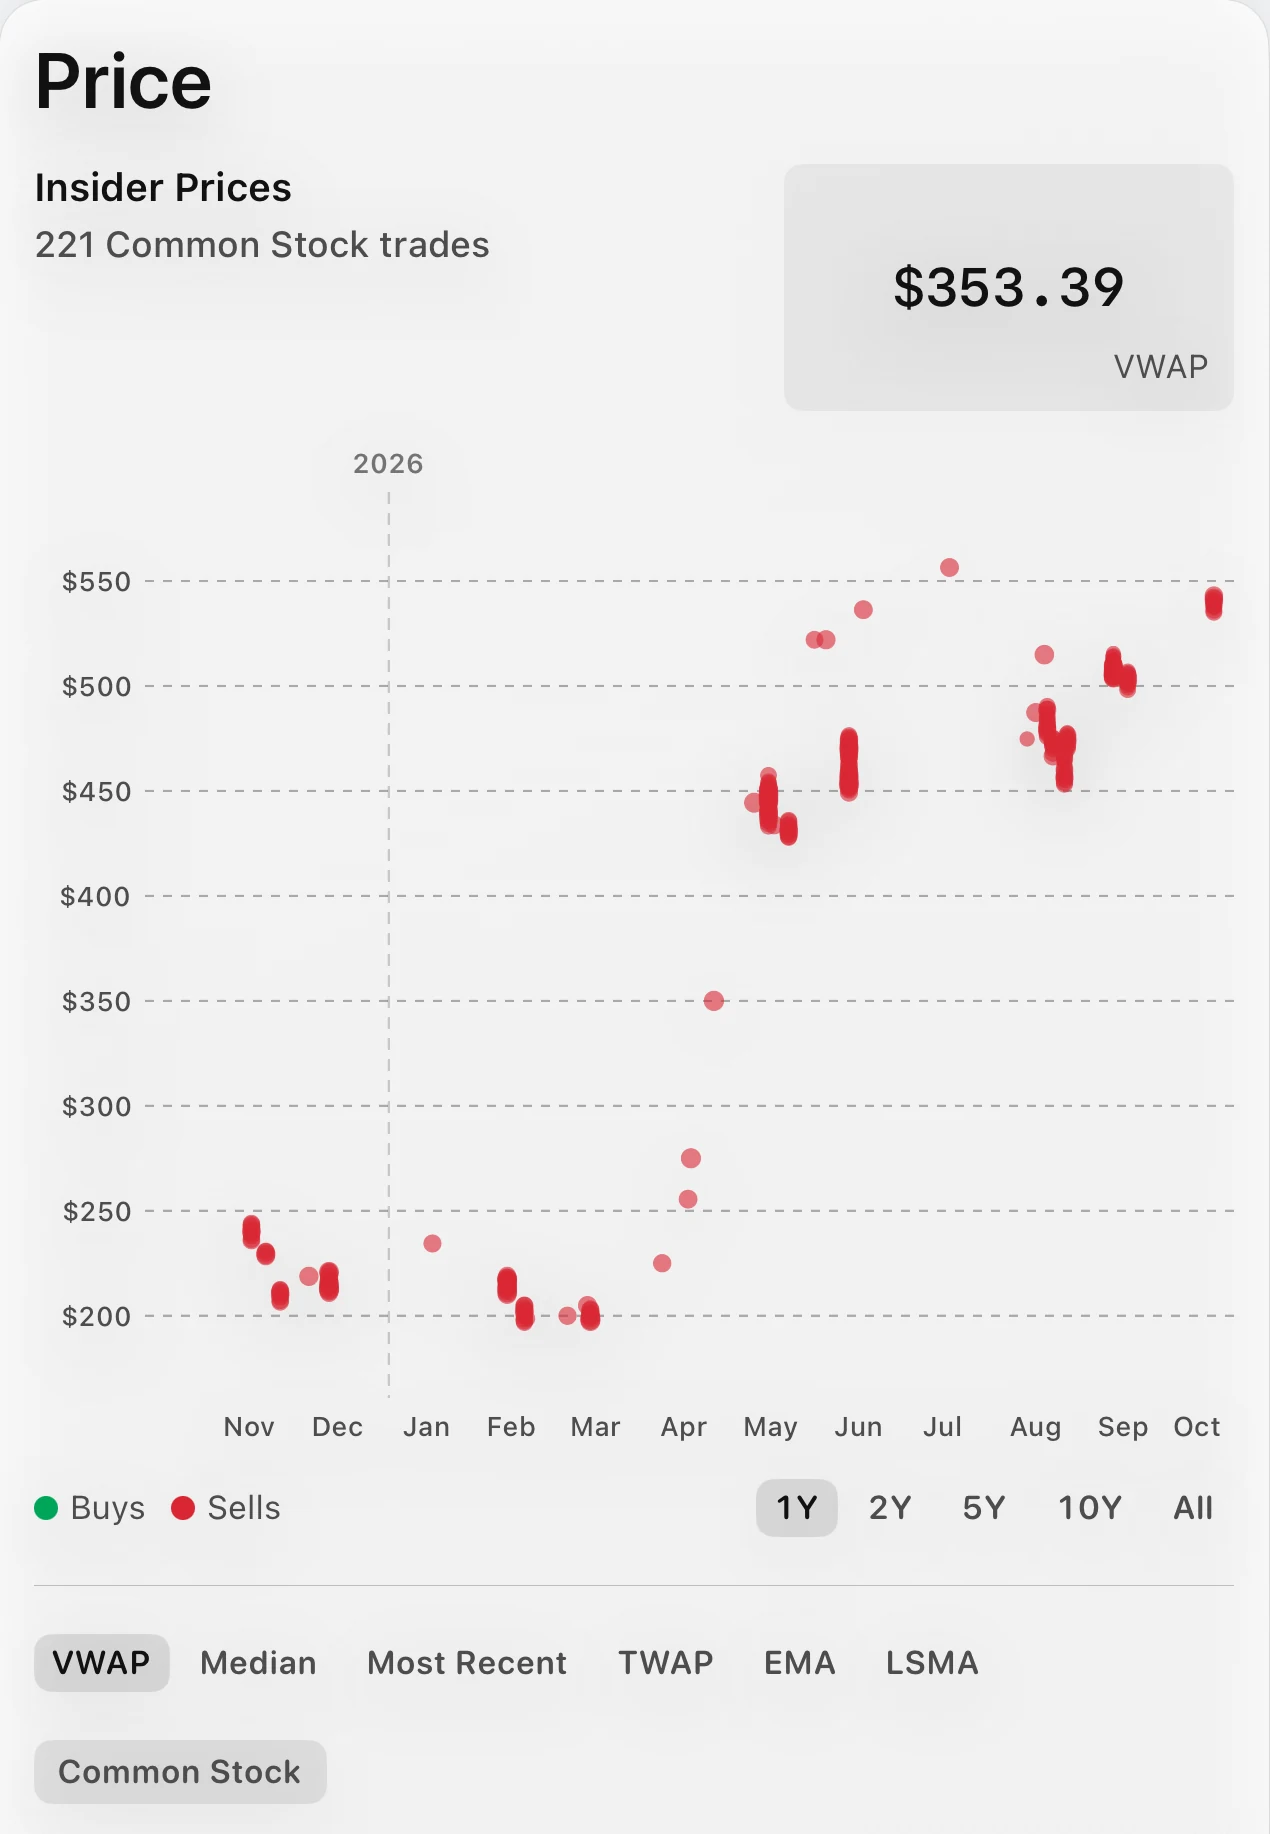
Insider prices
Insider trades plotted on the share price, with pricing modes, instrument kinds and time spans.
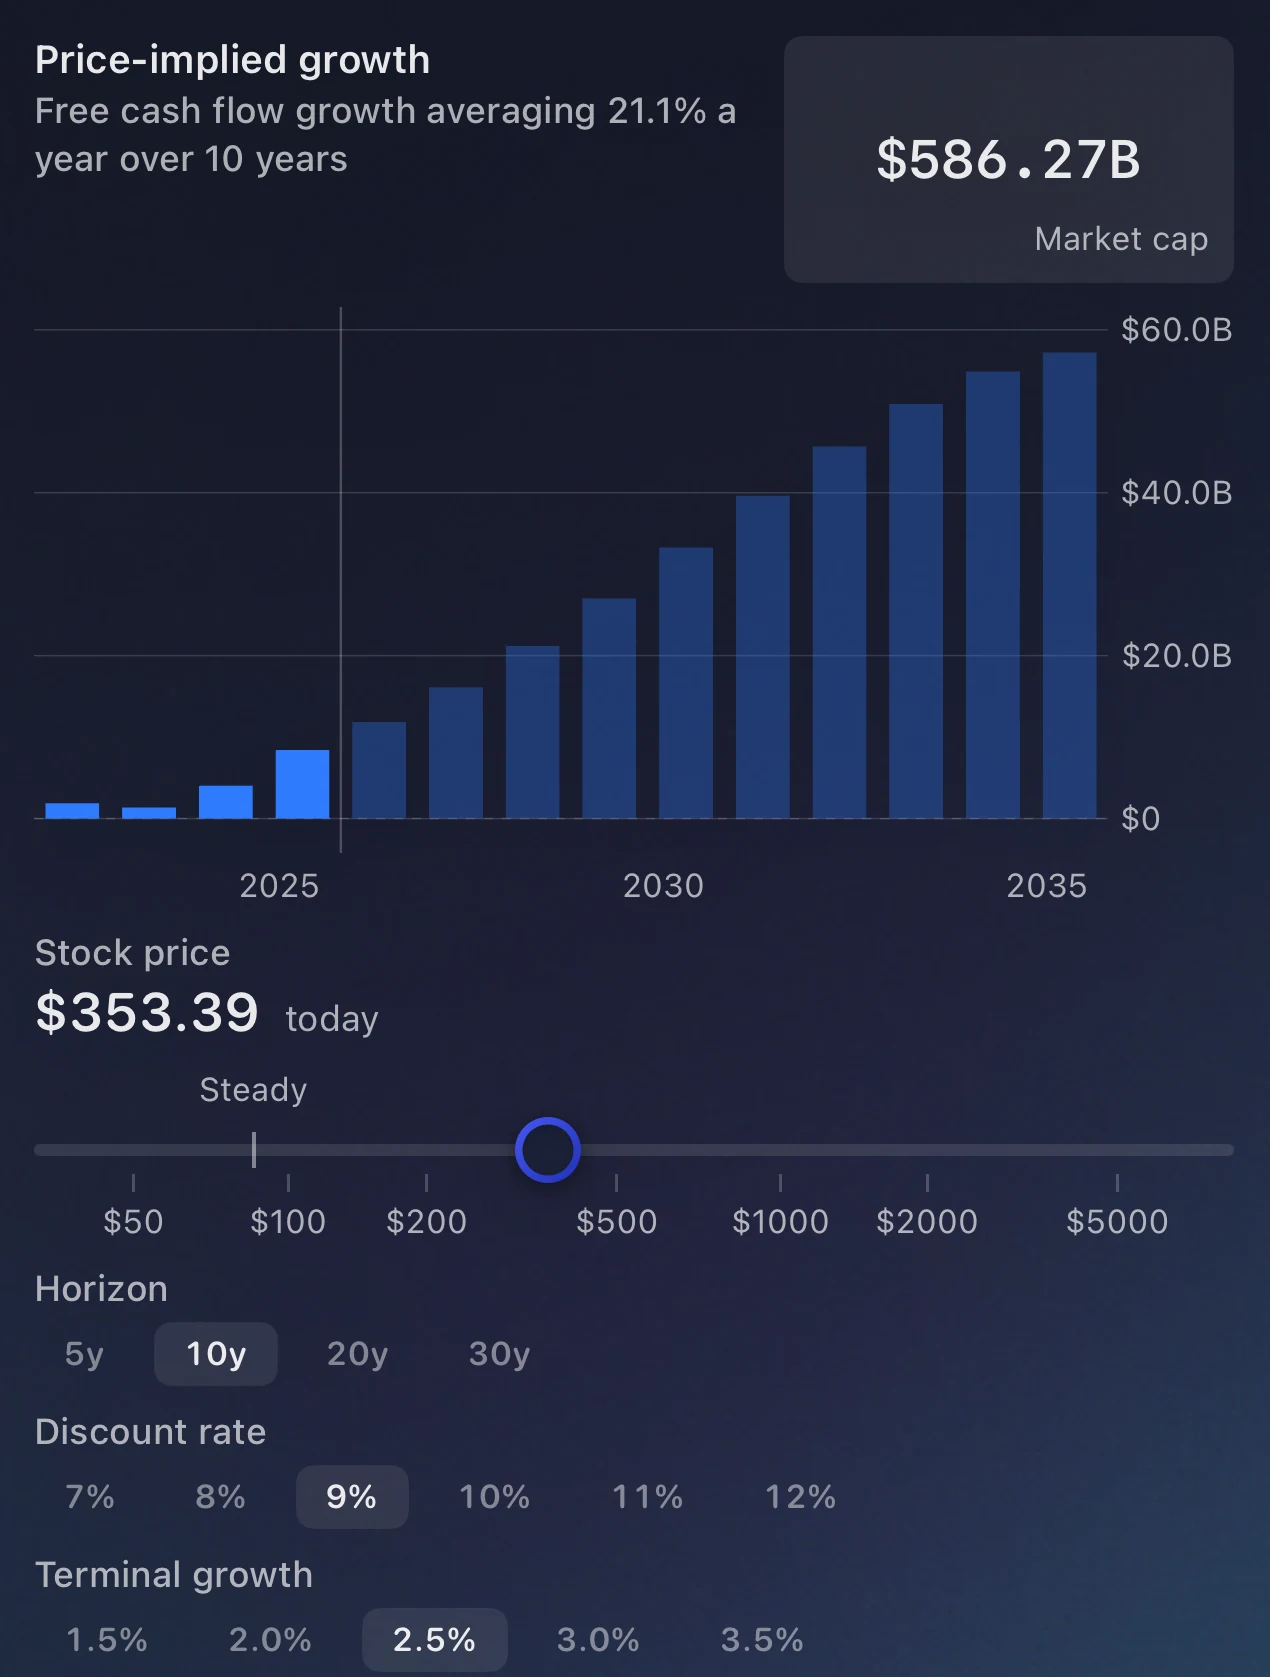
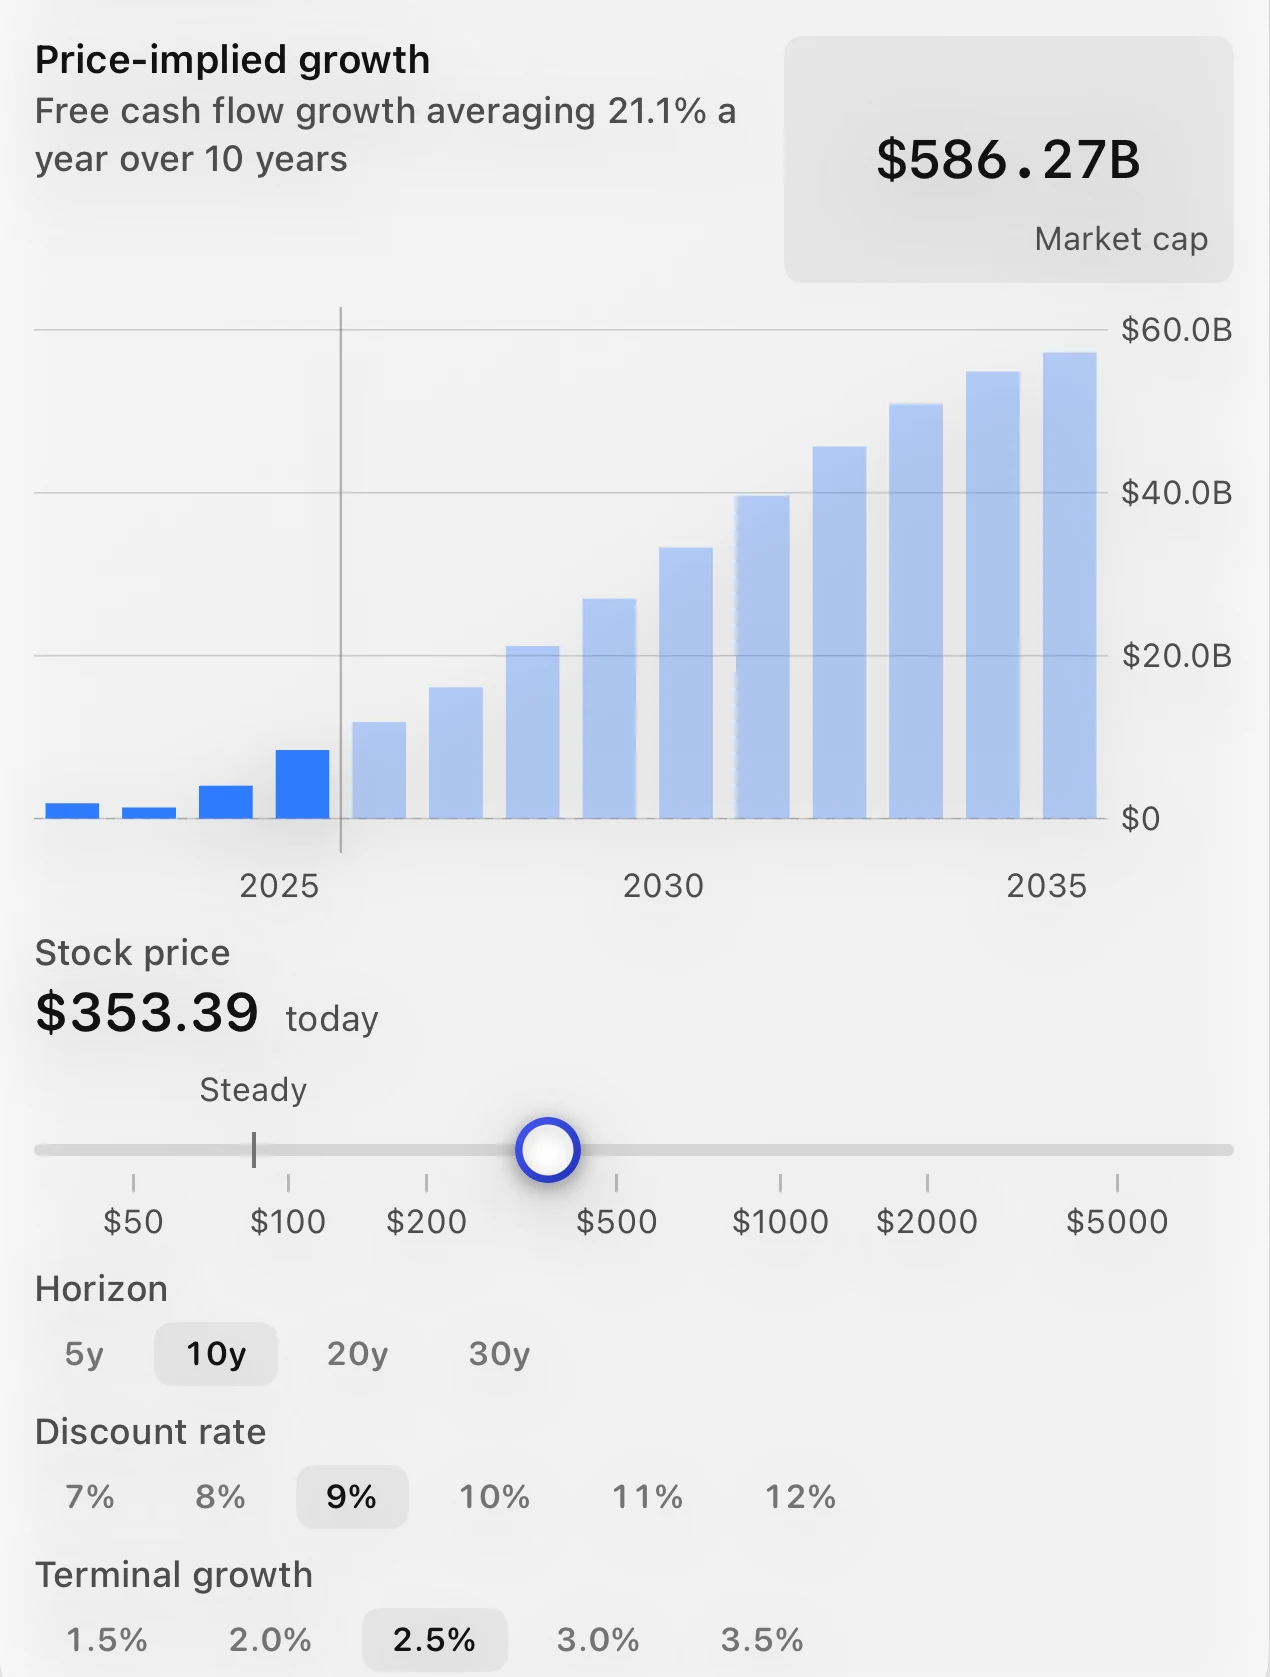
Price-implied growth
A slider turns a share price into the free cash flow growth it implies.
The charts
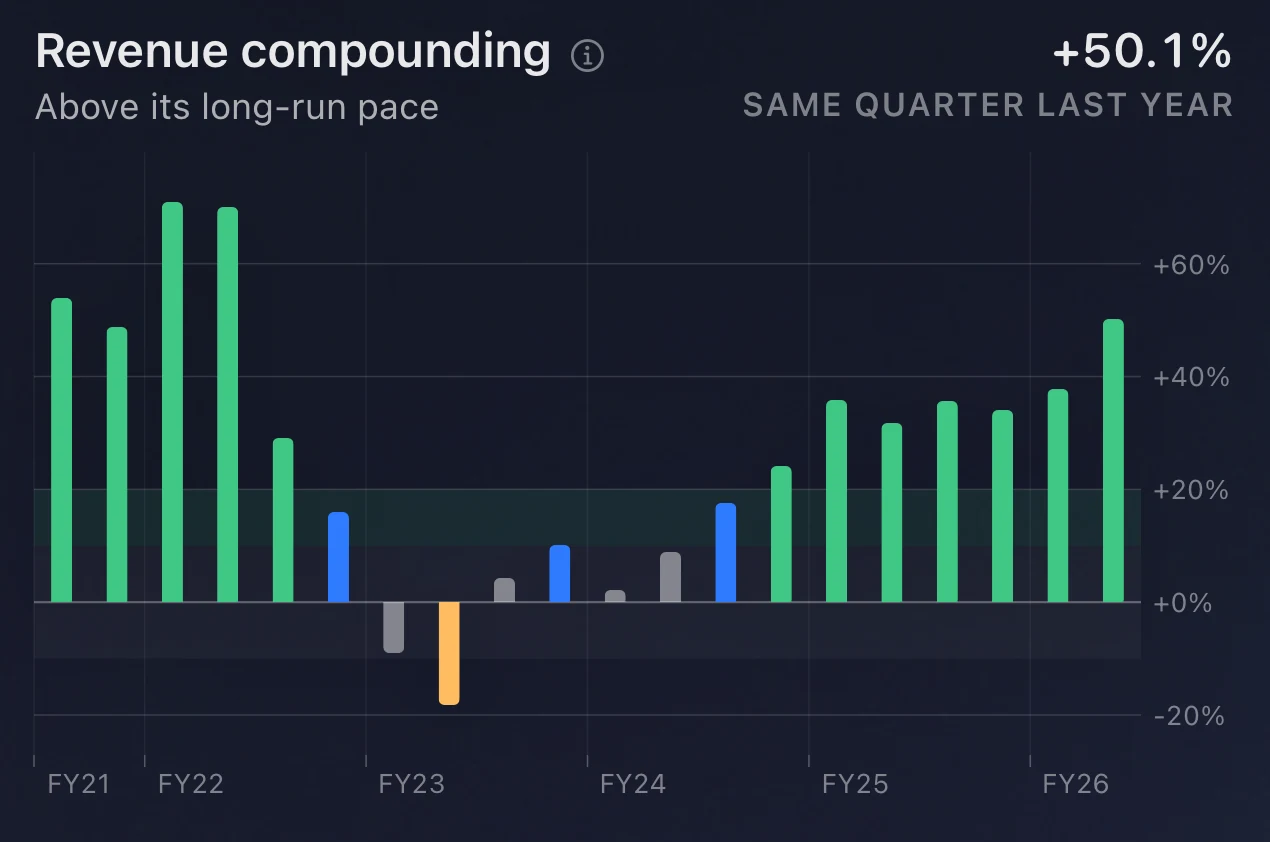
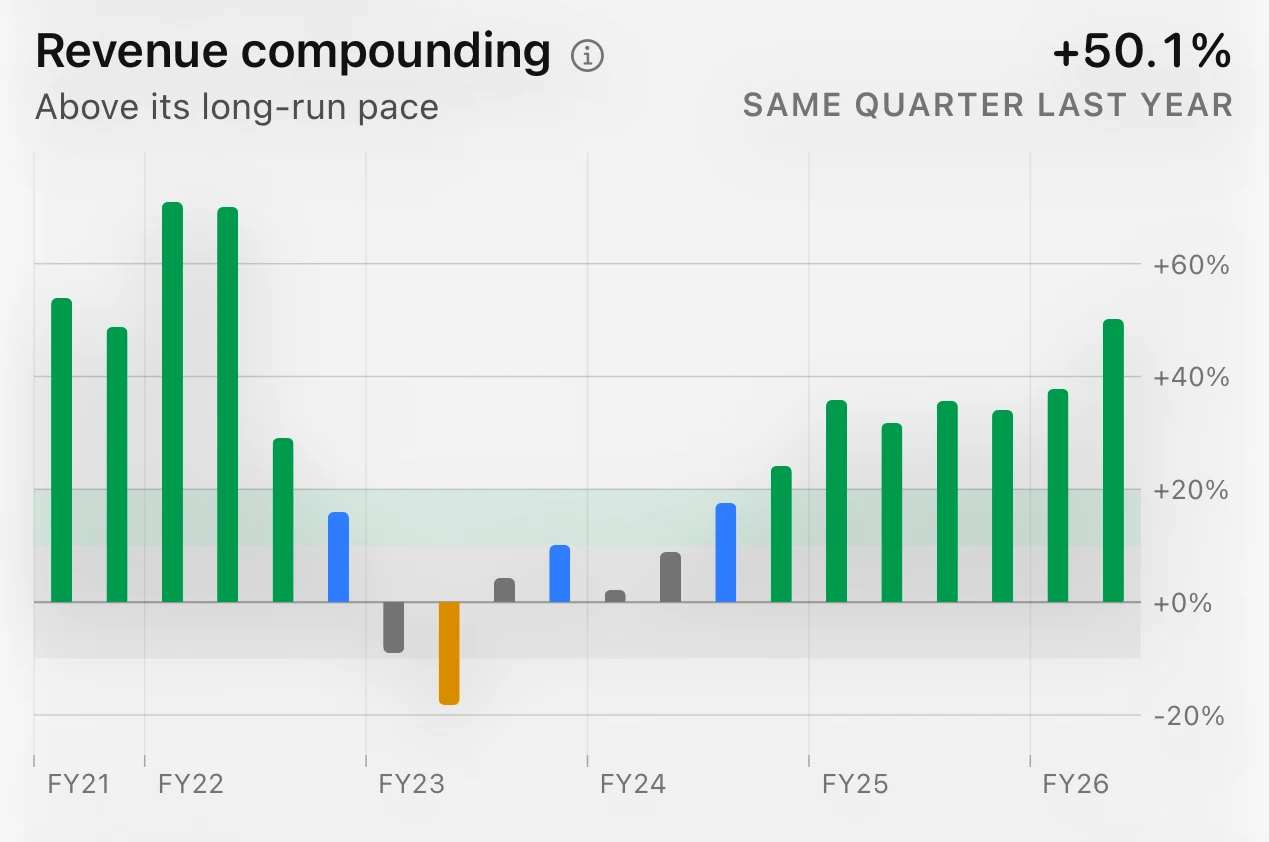
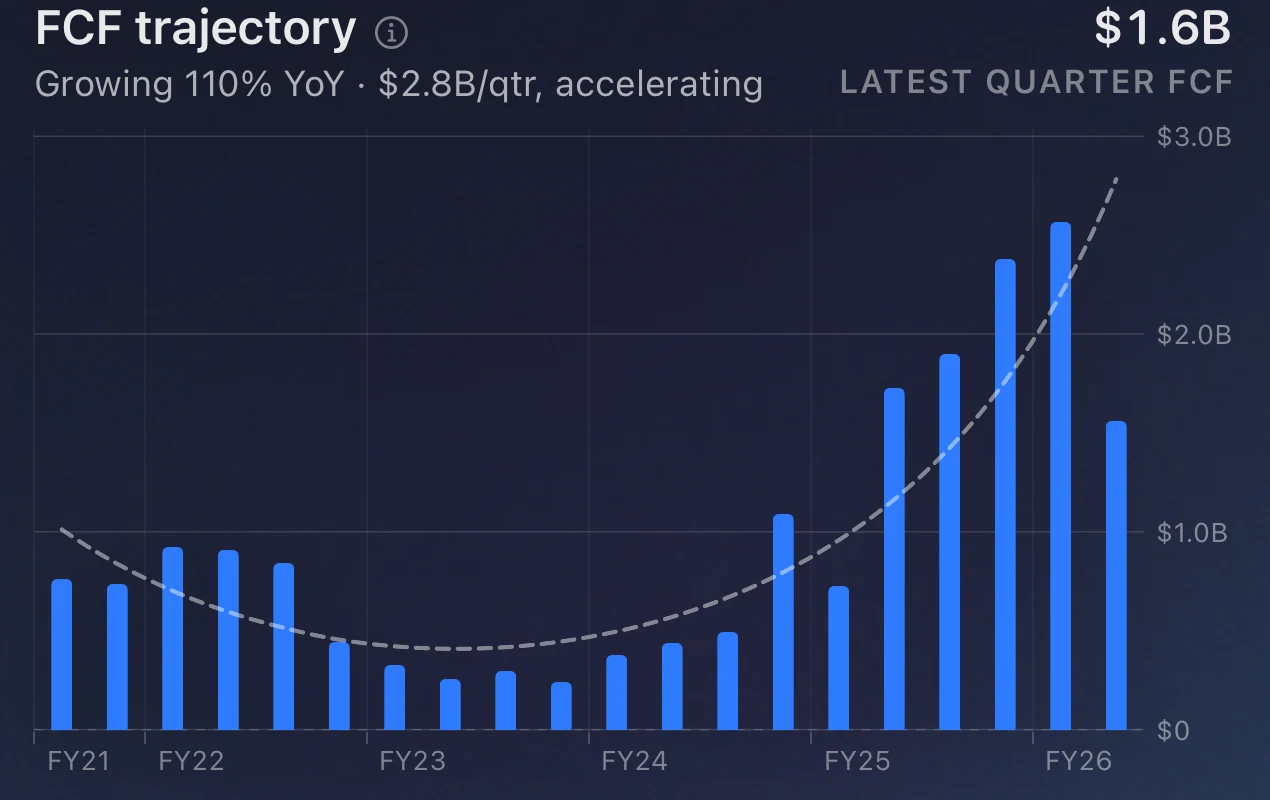
See years of business results.
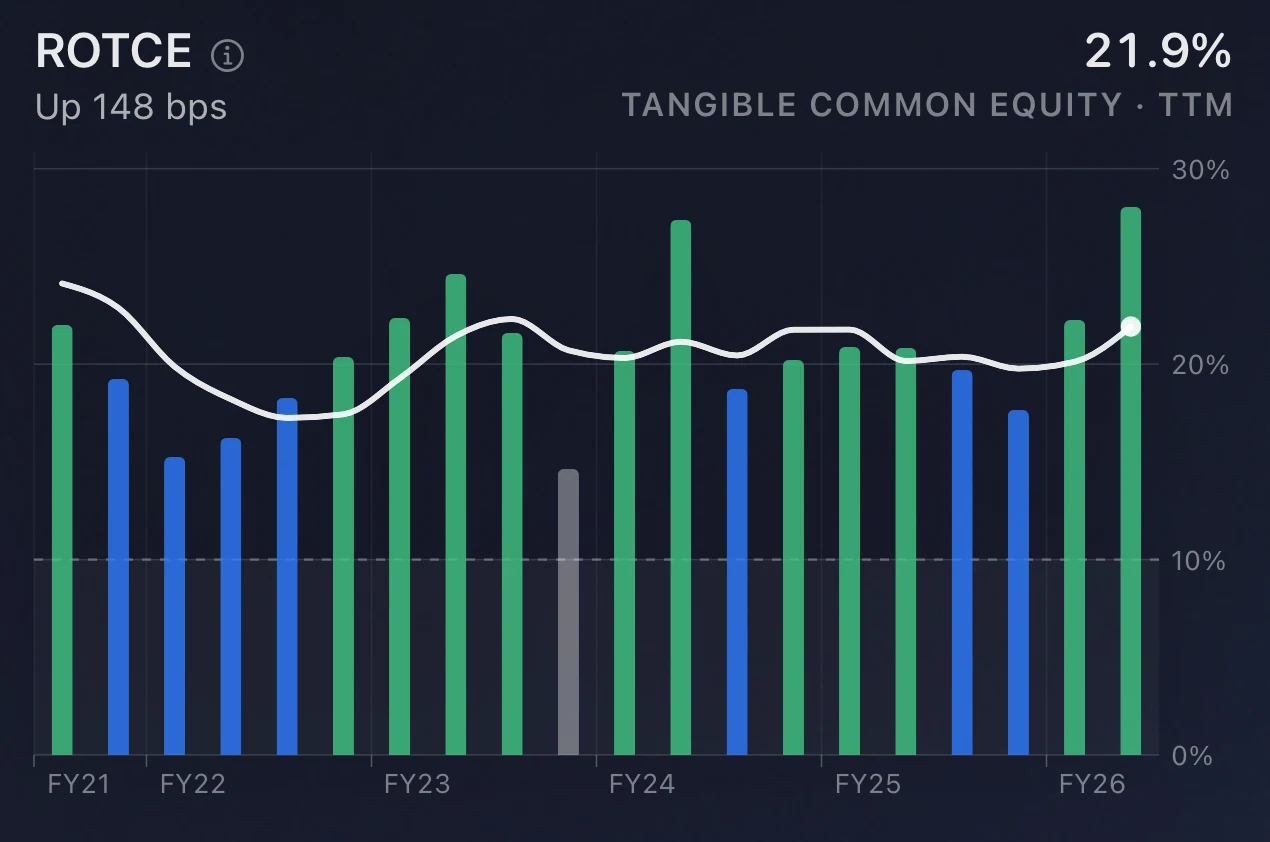
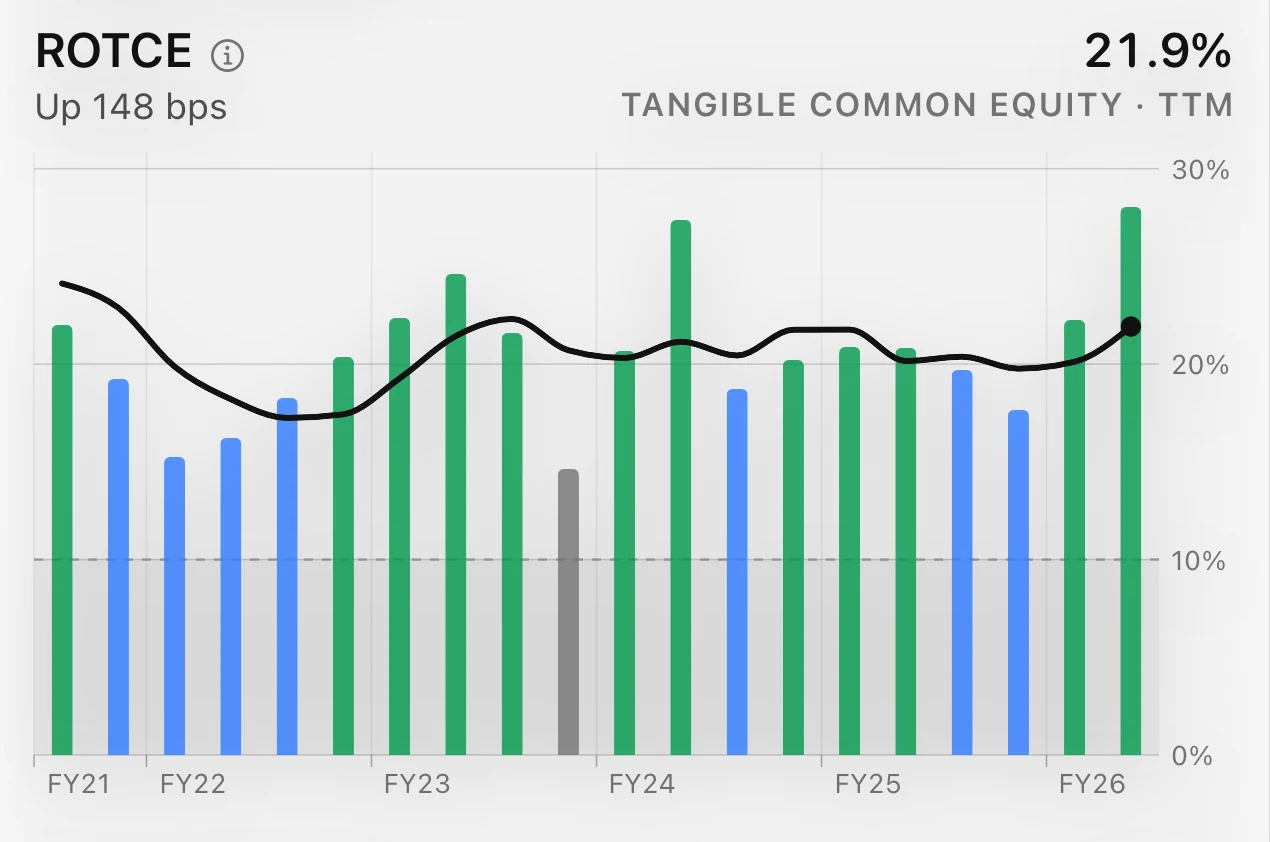
The headline
What the chart measures and where it stands, with the latest figure and its basis.
The reference
A band from published research or the company’s own history, to read each period against.
The record
One mark for each period the filings report.
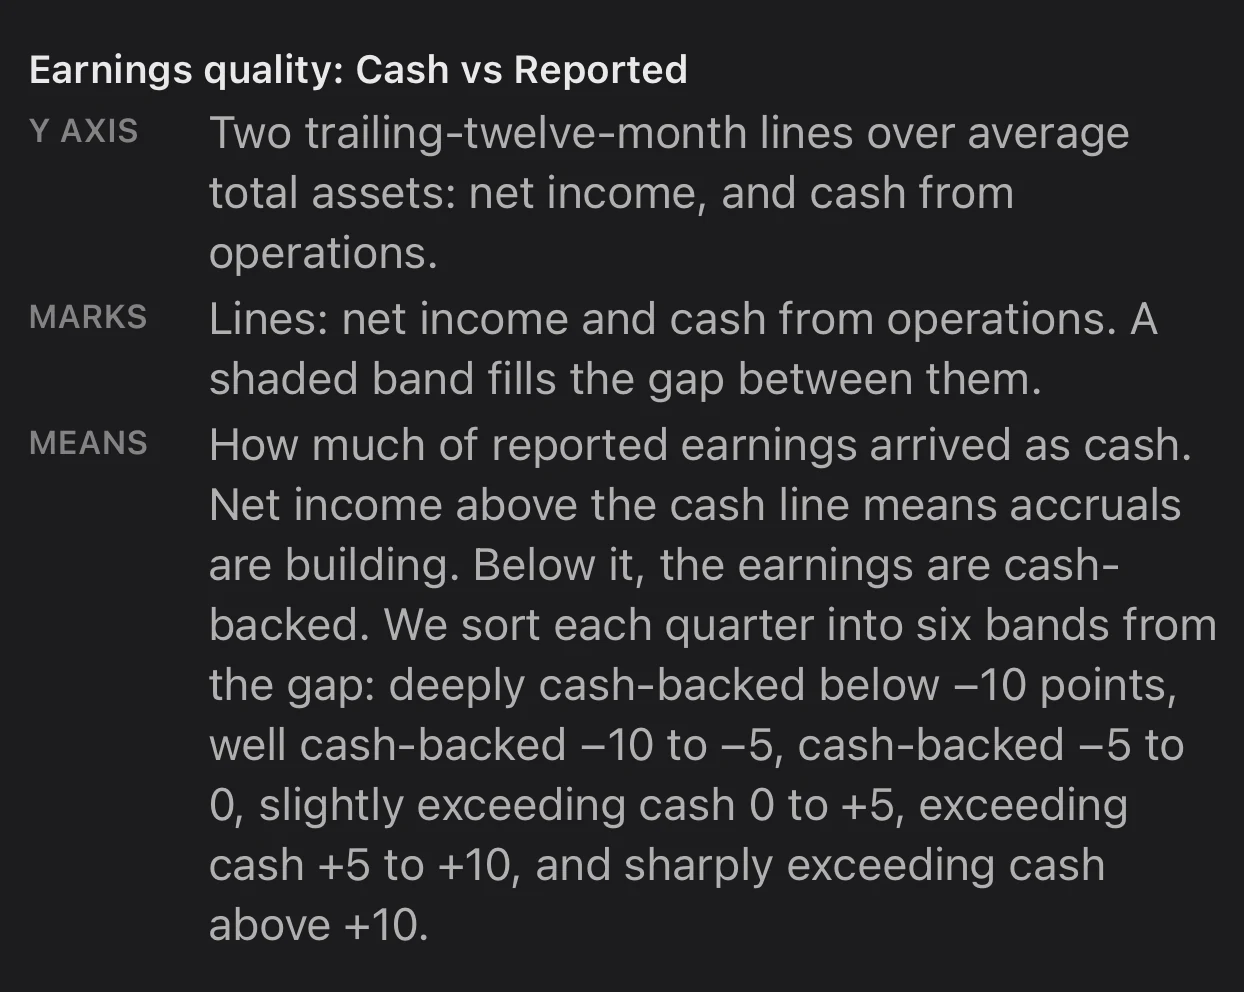
The explainer
The info button on each chart states how it is built and what each mark means.
Banks, insurers and REITs
Each gets a set of charts made for how it reports.
Following
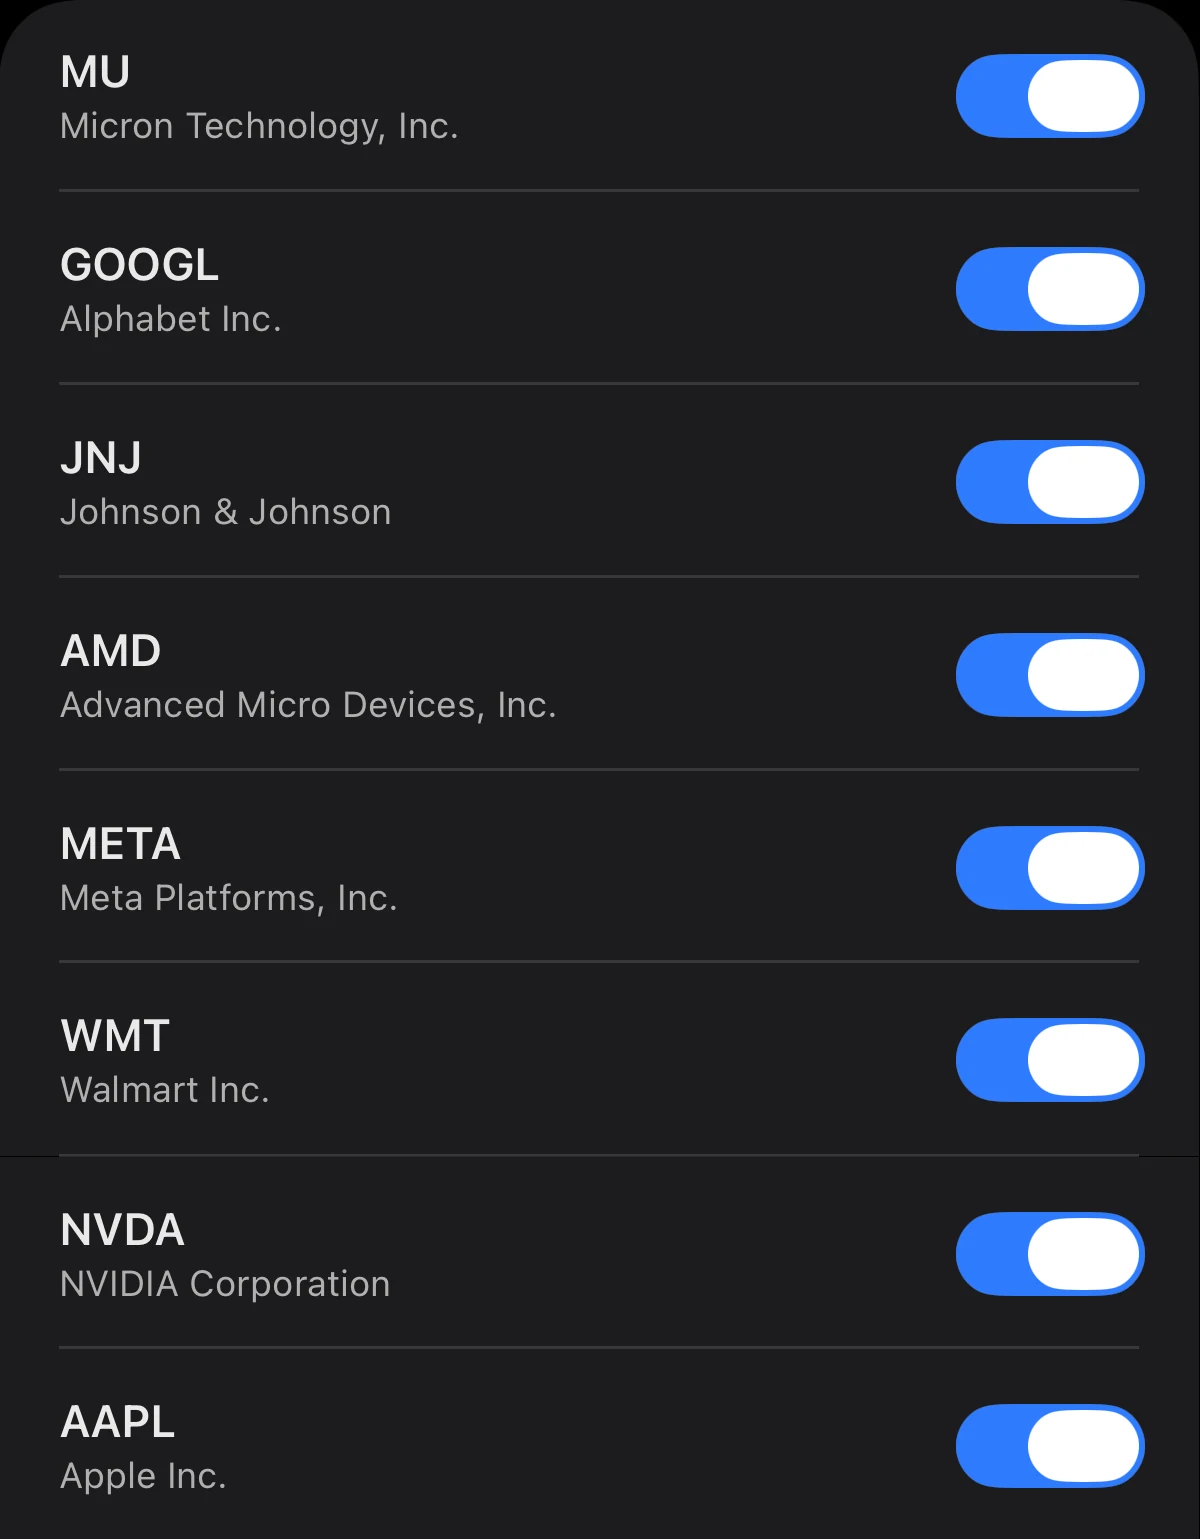
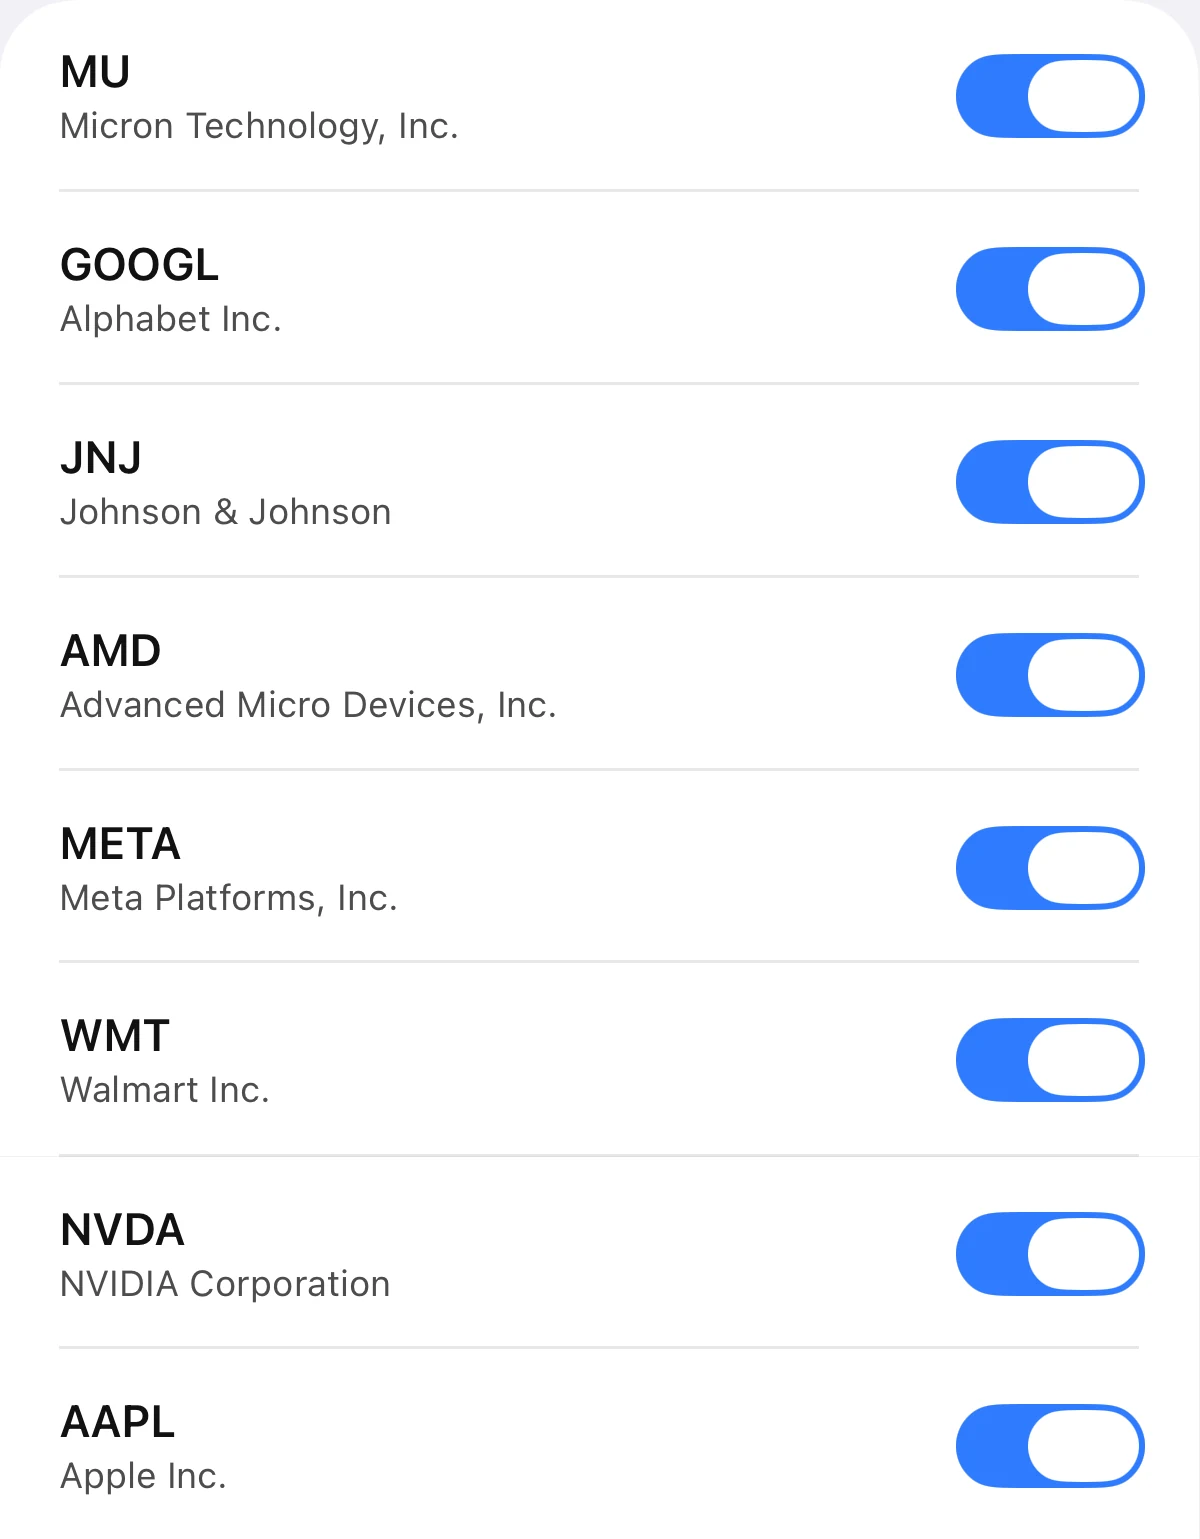
Keep up with the companies you follow.
Add up to 100, by ticker or a whole watchlist at once.
The Wire
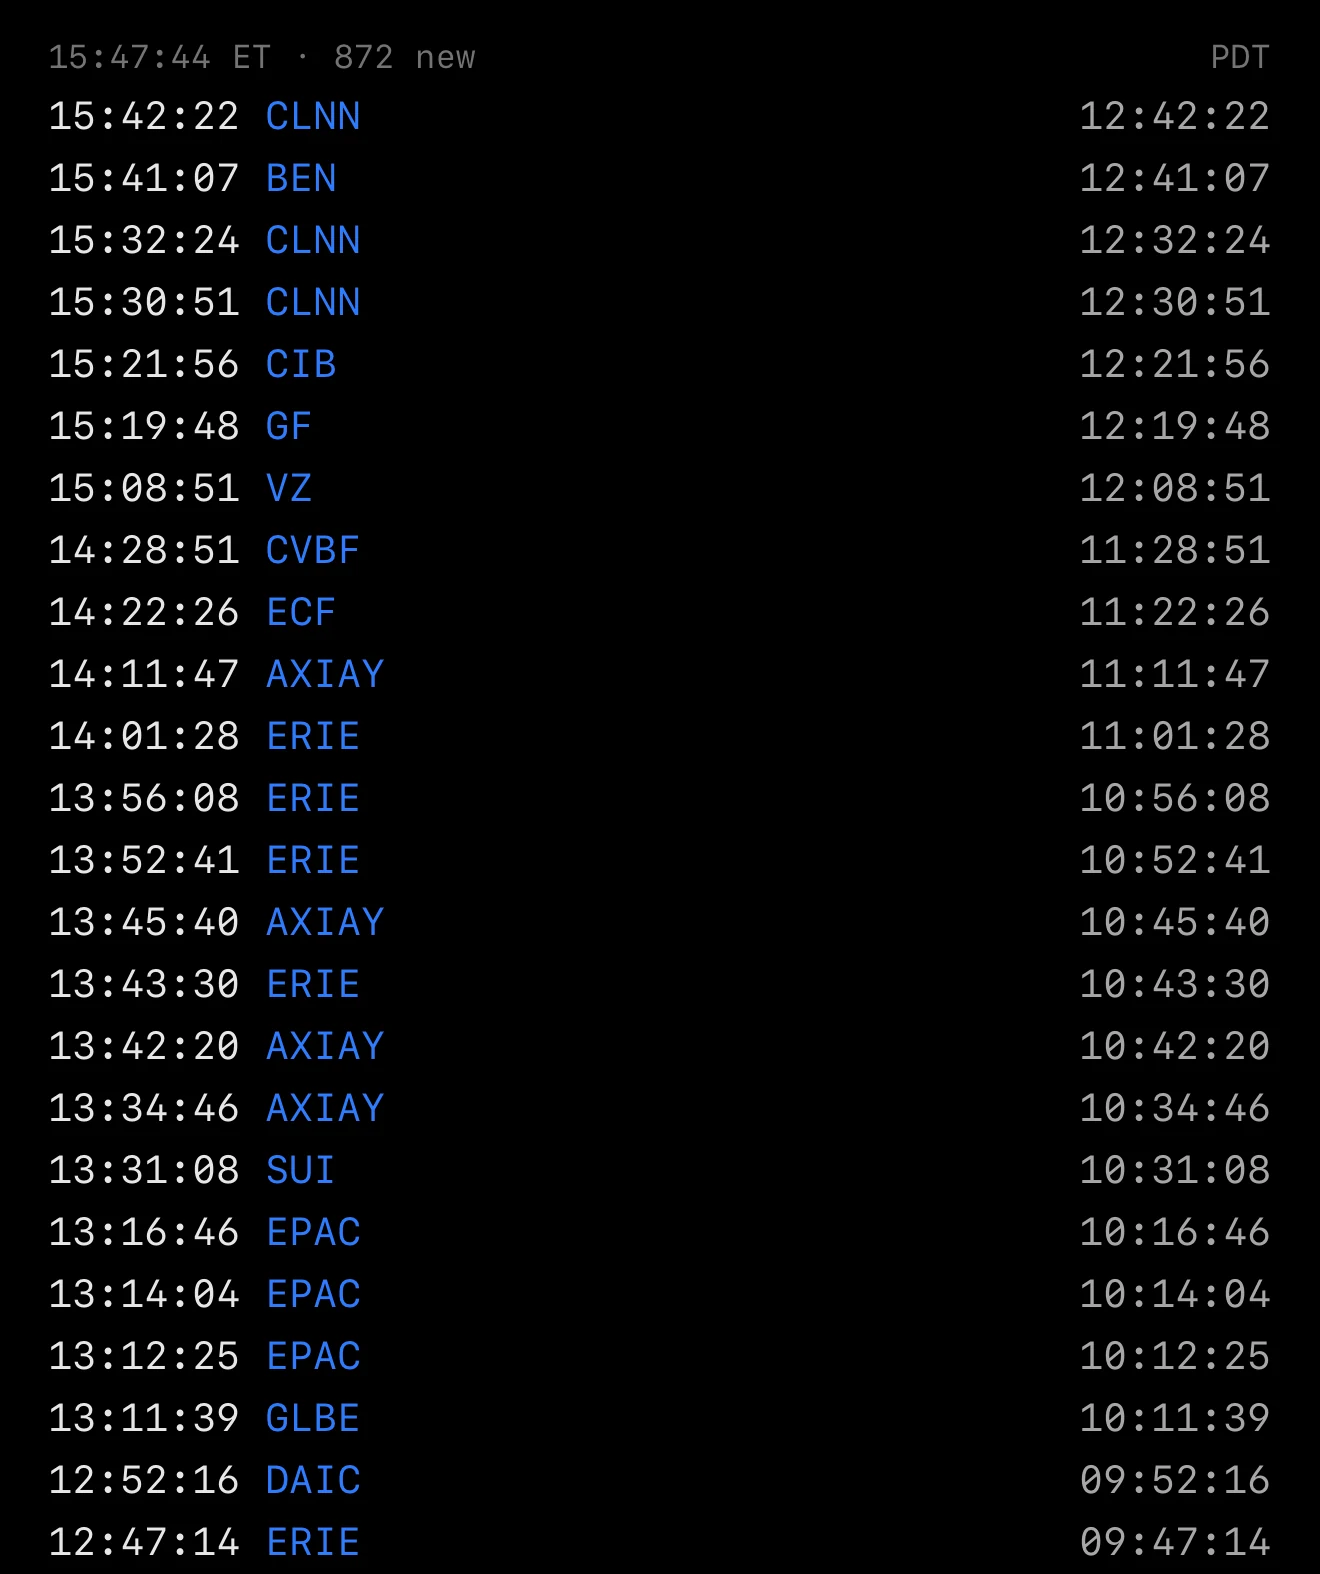
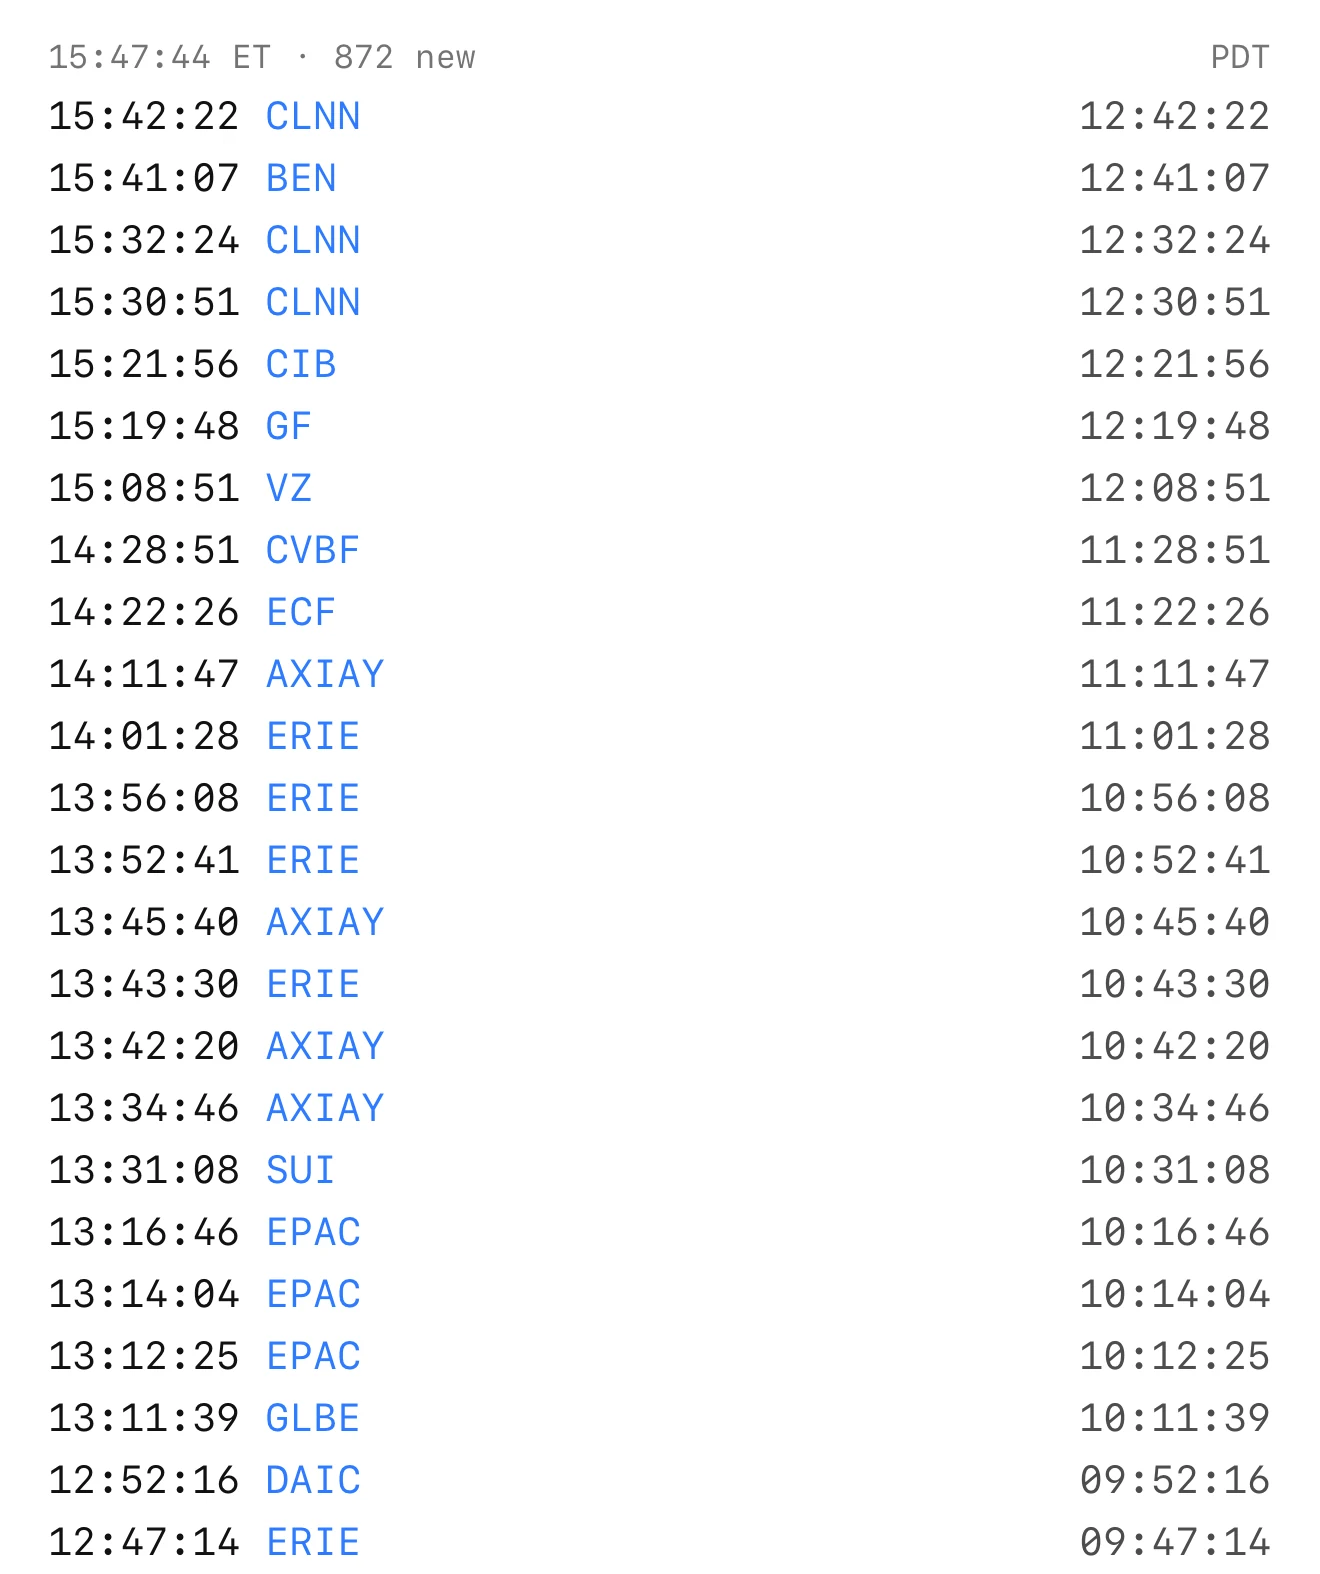
See who is filing on EDGAR.
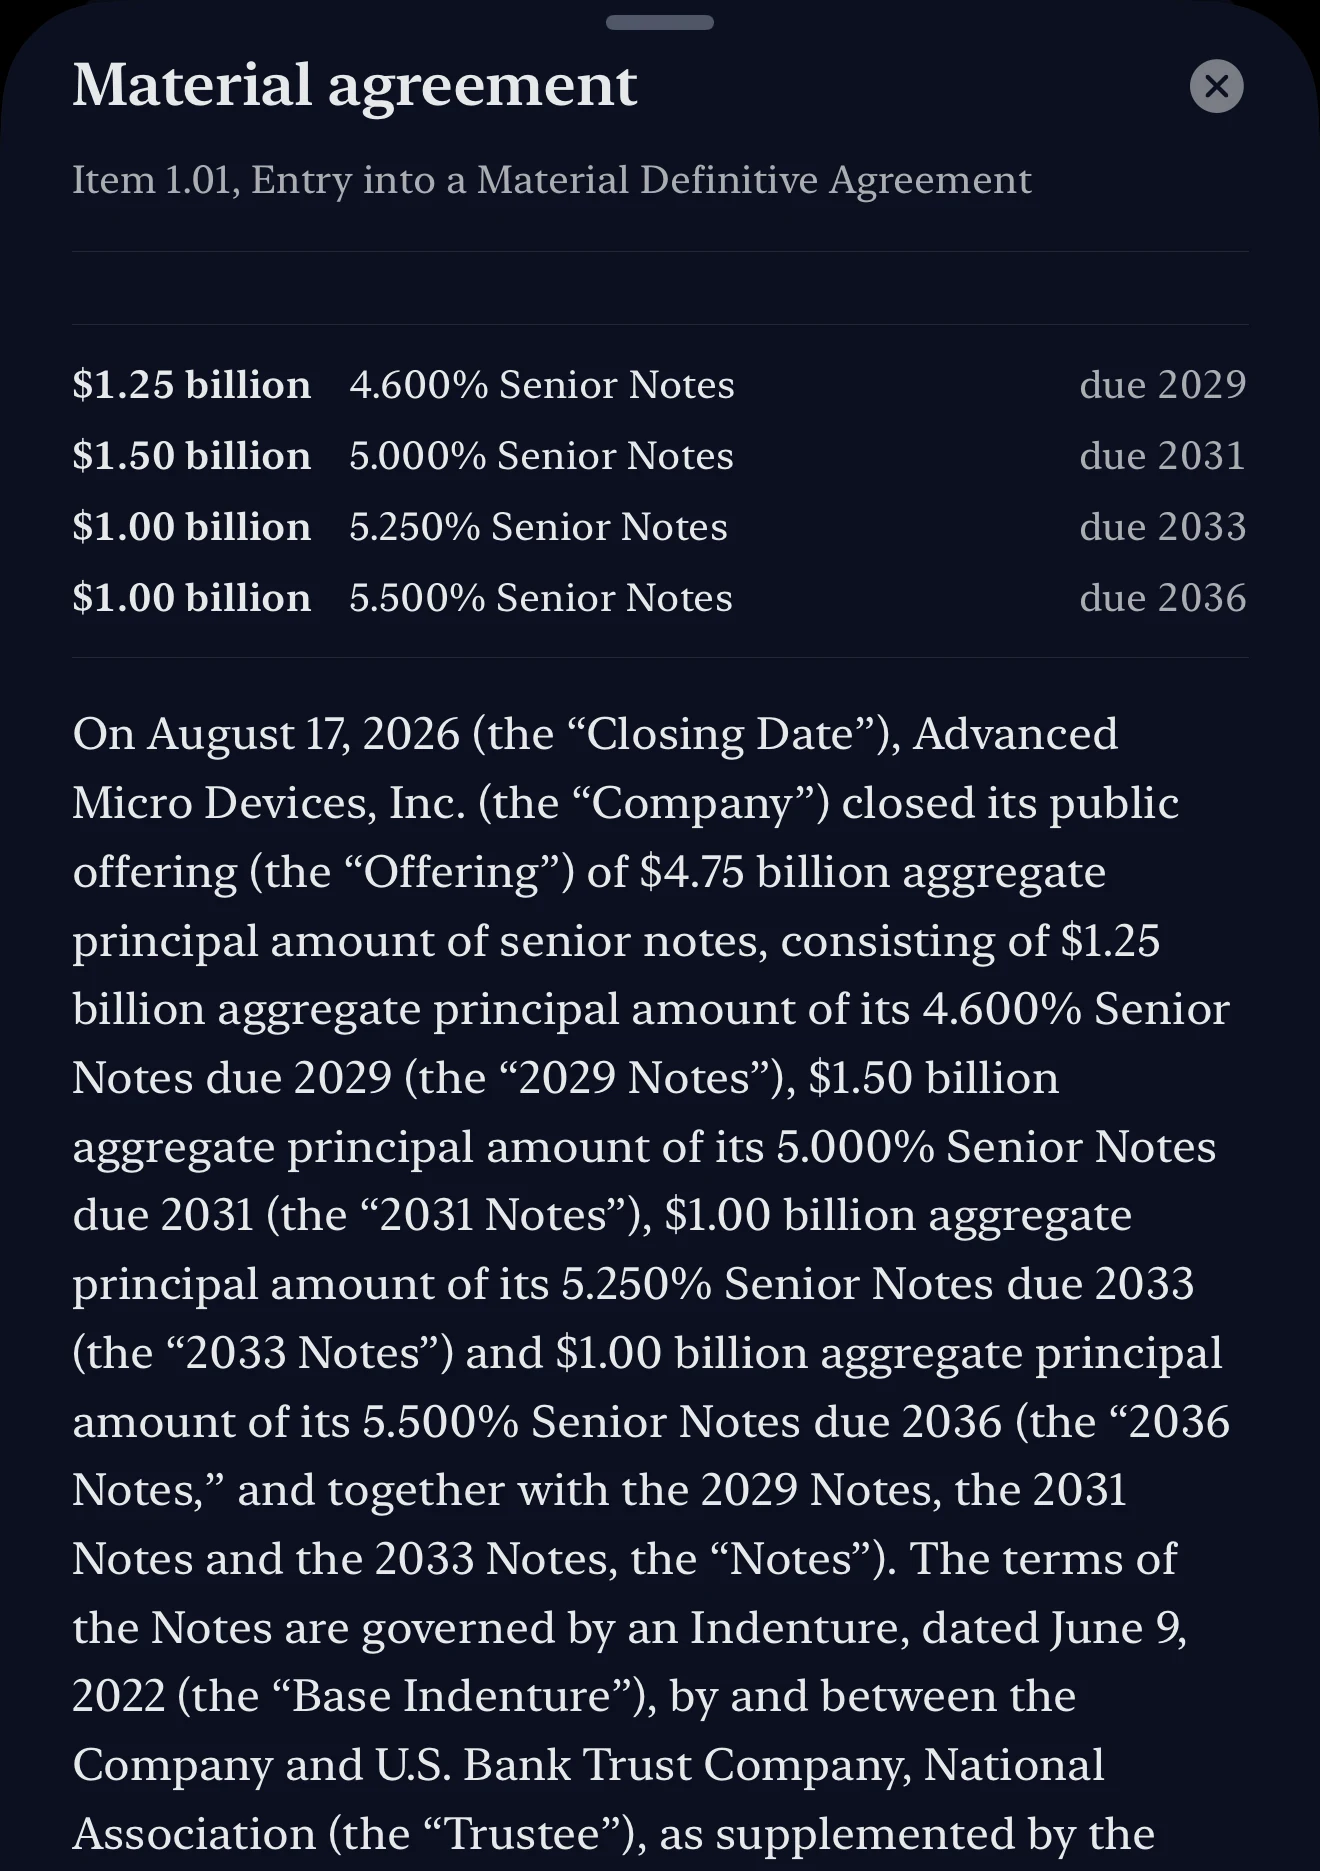
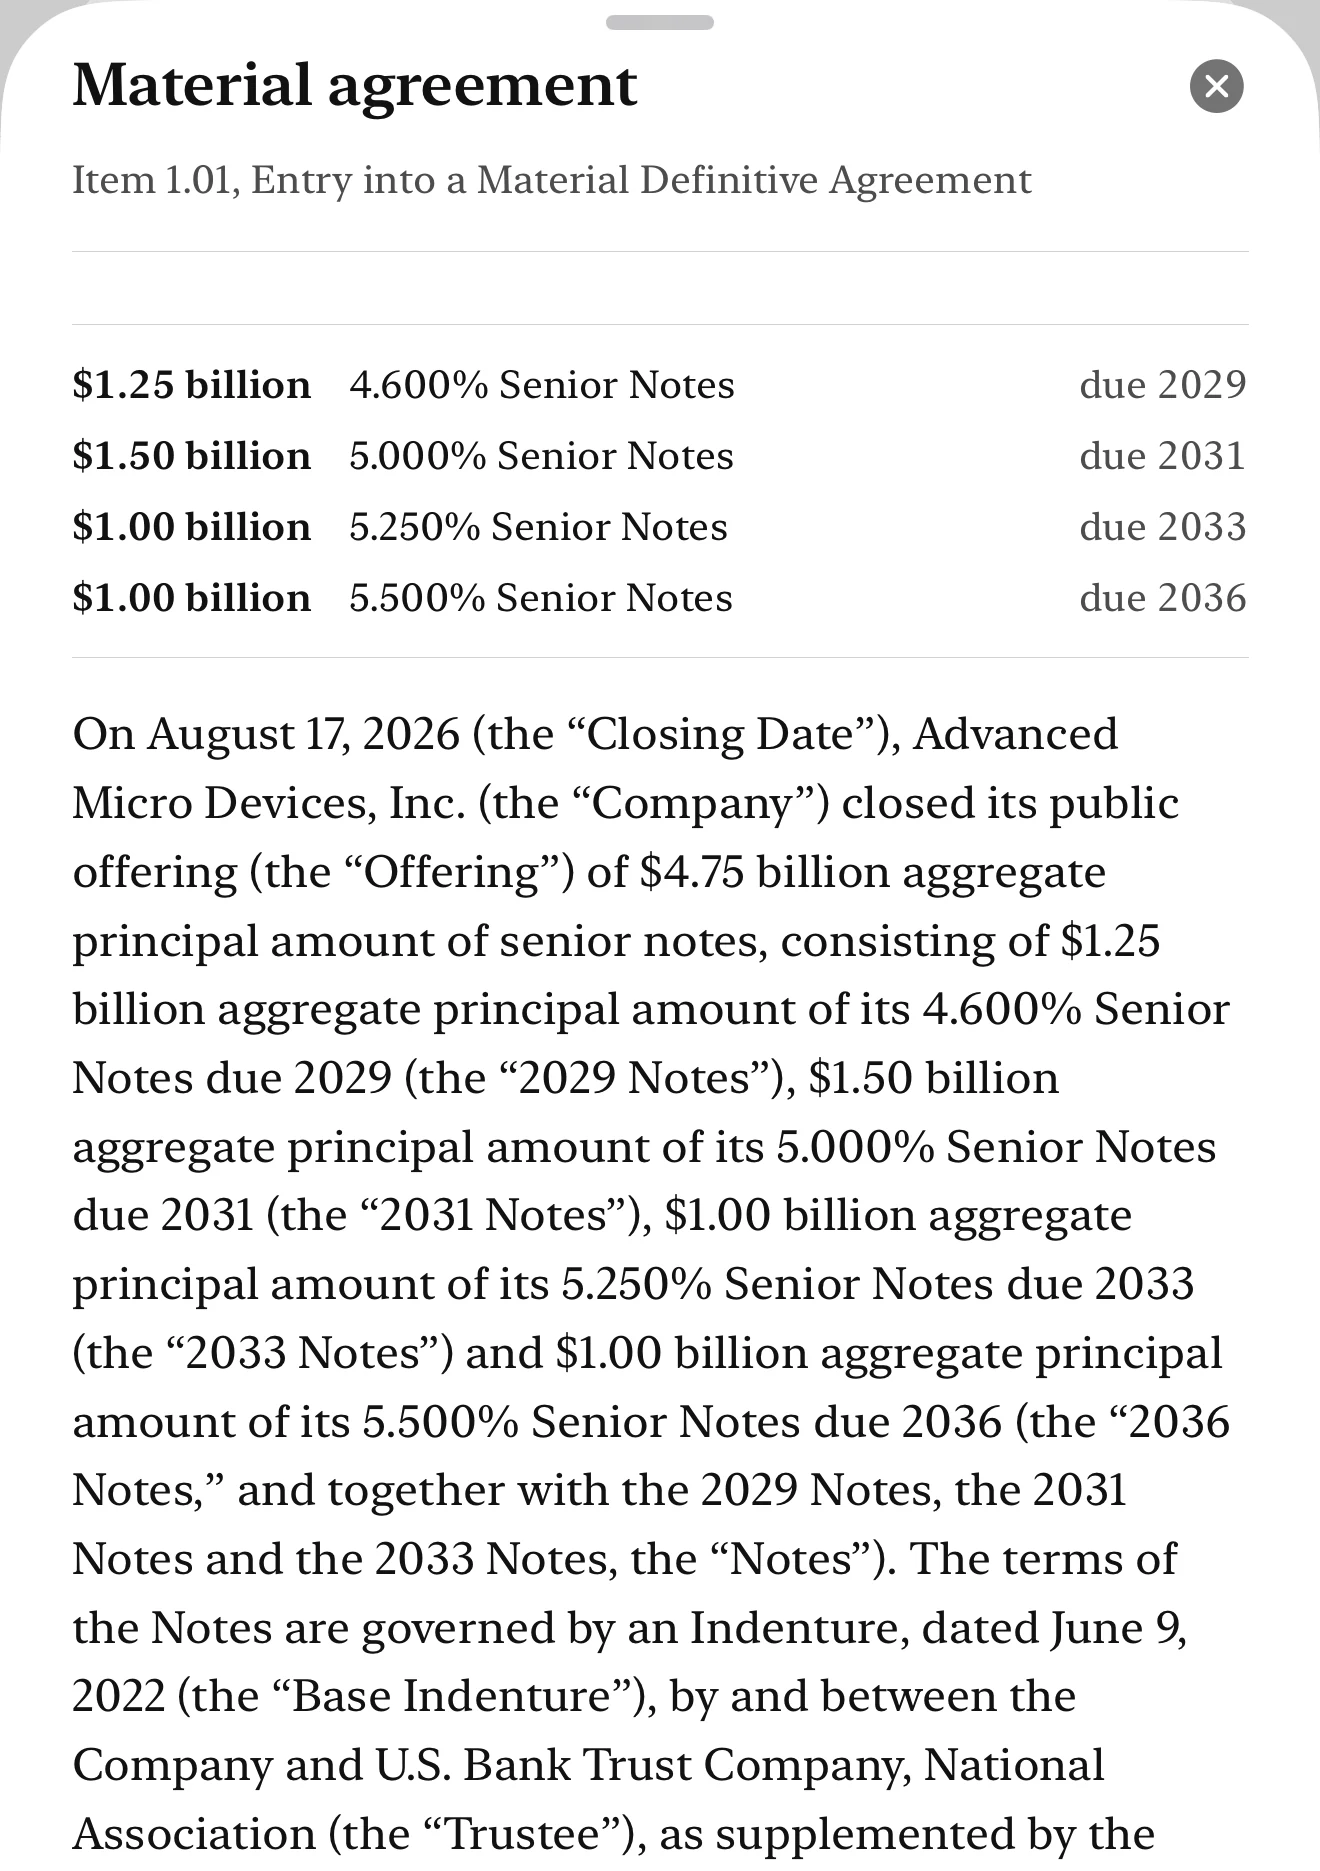
The app checks for new filings throughout the day. Tap a row to open the filing. Tap the ticker to follow the company or add it to a watchlist.
News Room
Get the news from the company.
Stay updated on important disclosures, company by company.
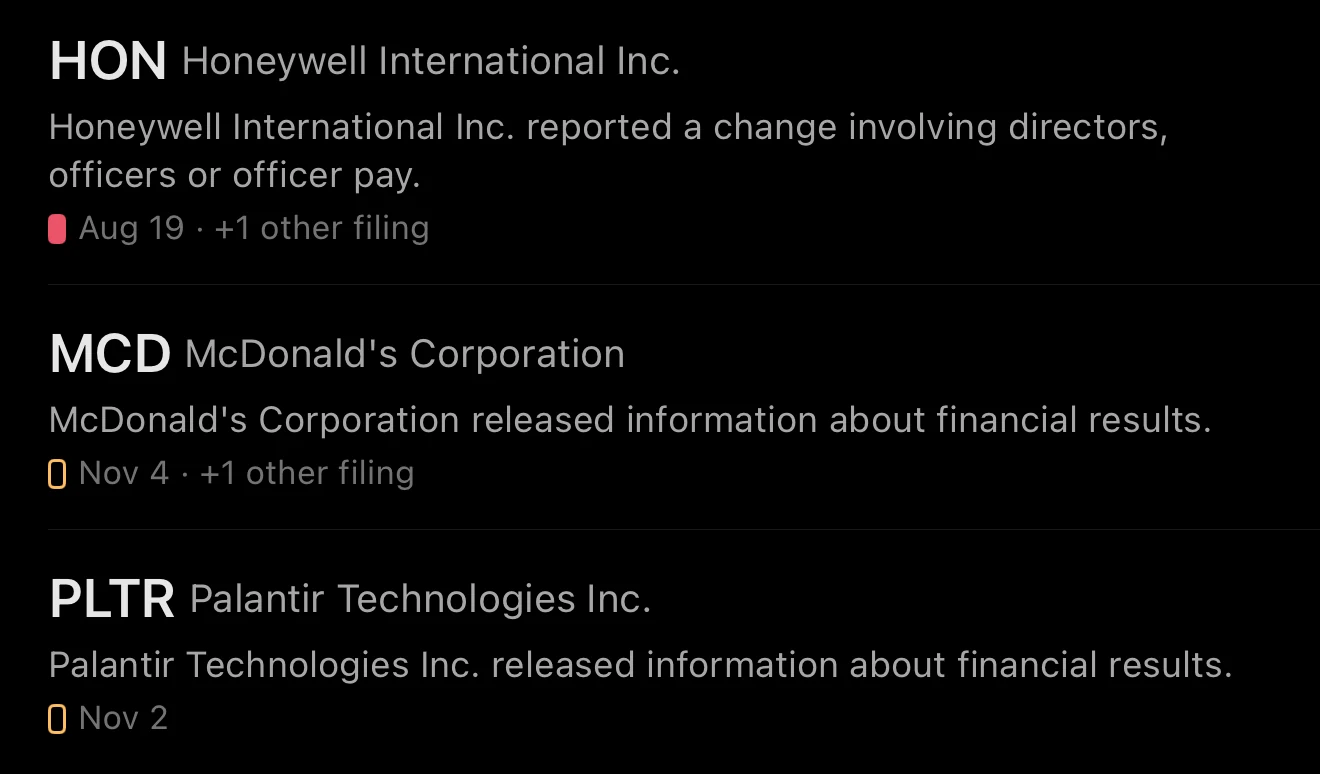
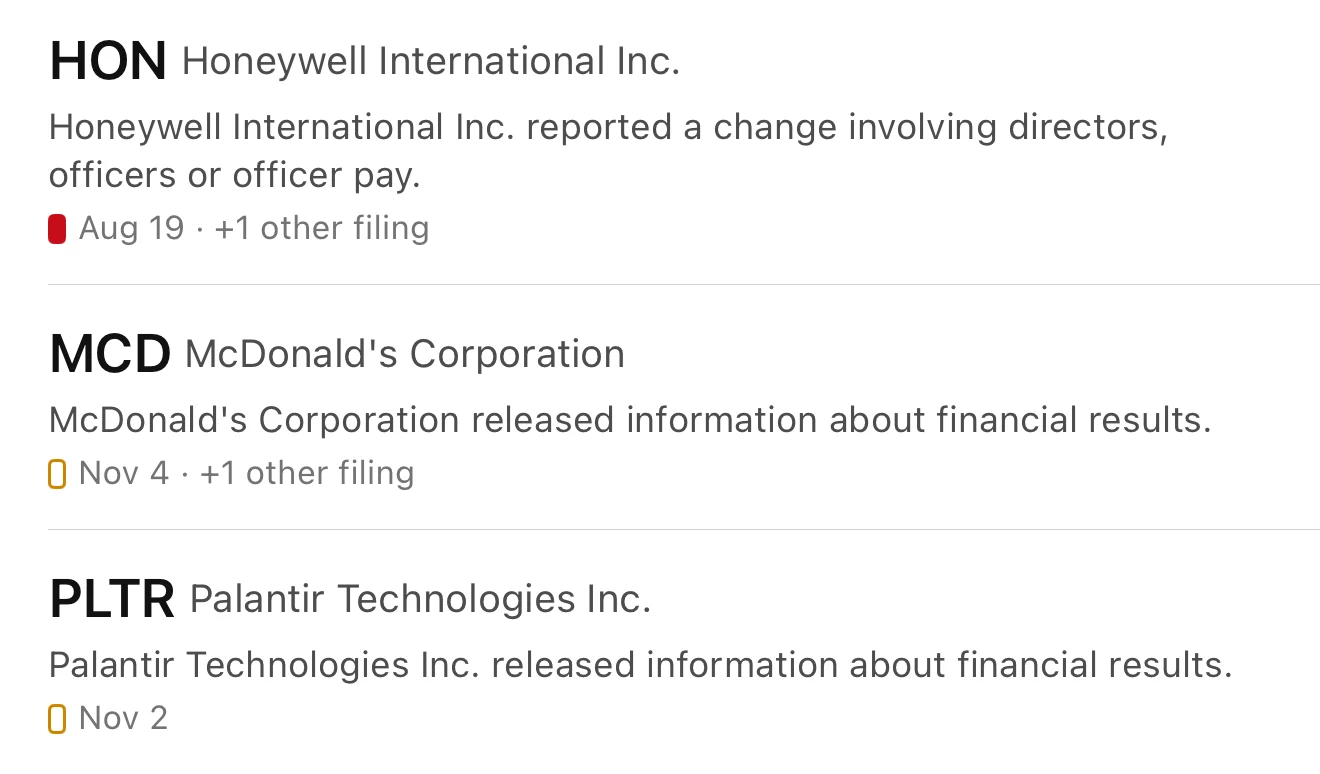
The row
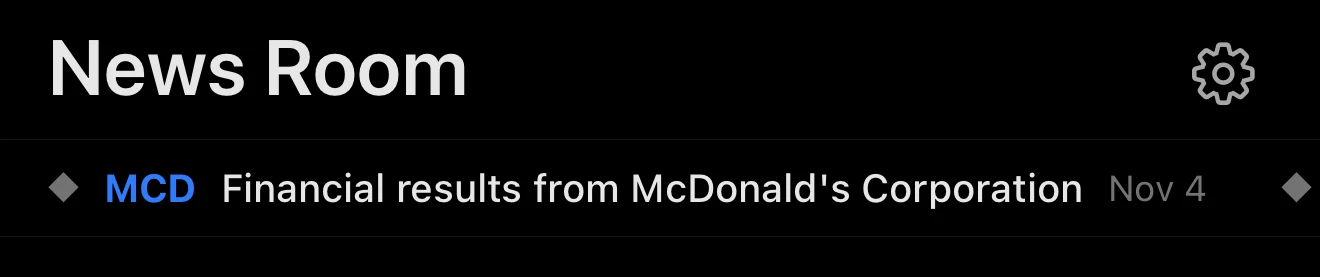
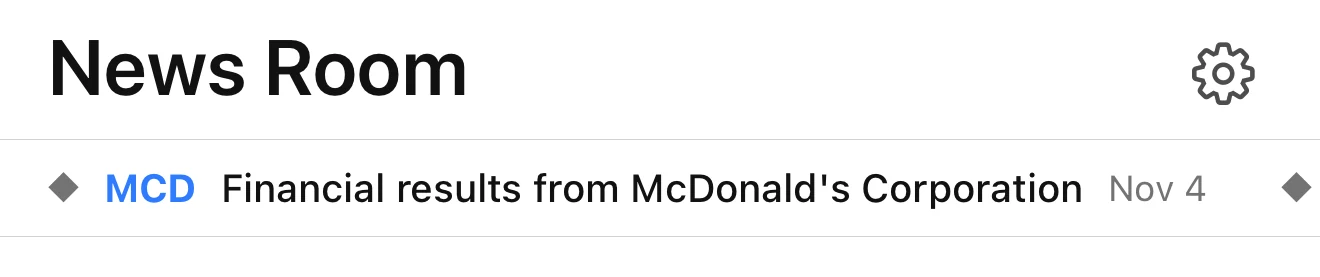
A headline for the lead 8-K at each company, with the date it was filed and the count of other filings.
The chyron
Headlines from across the Following list, on a scrolling strip. A tap opens the company sheet.
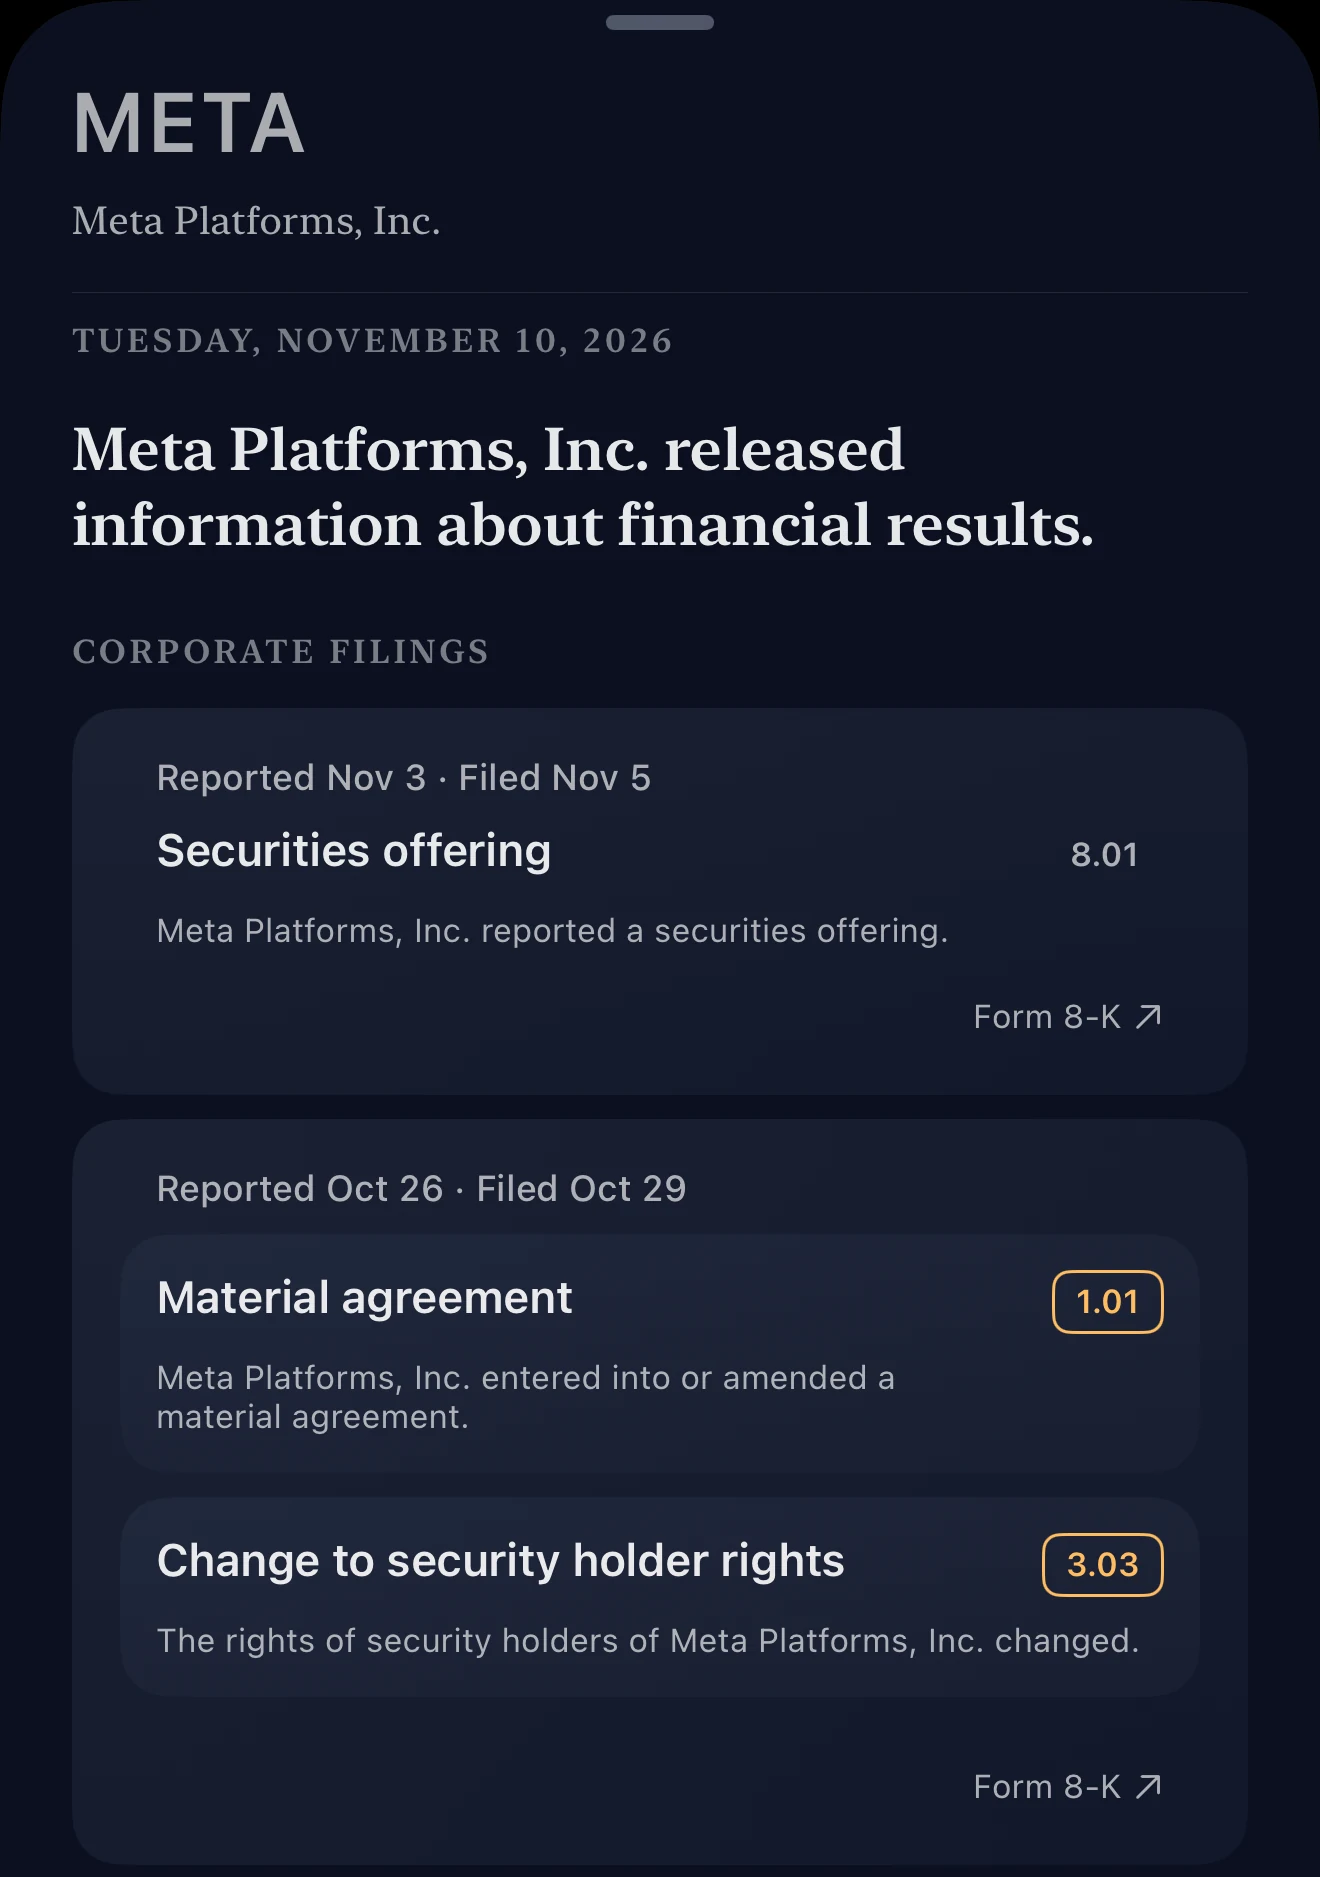
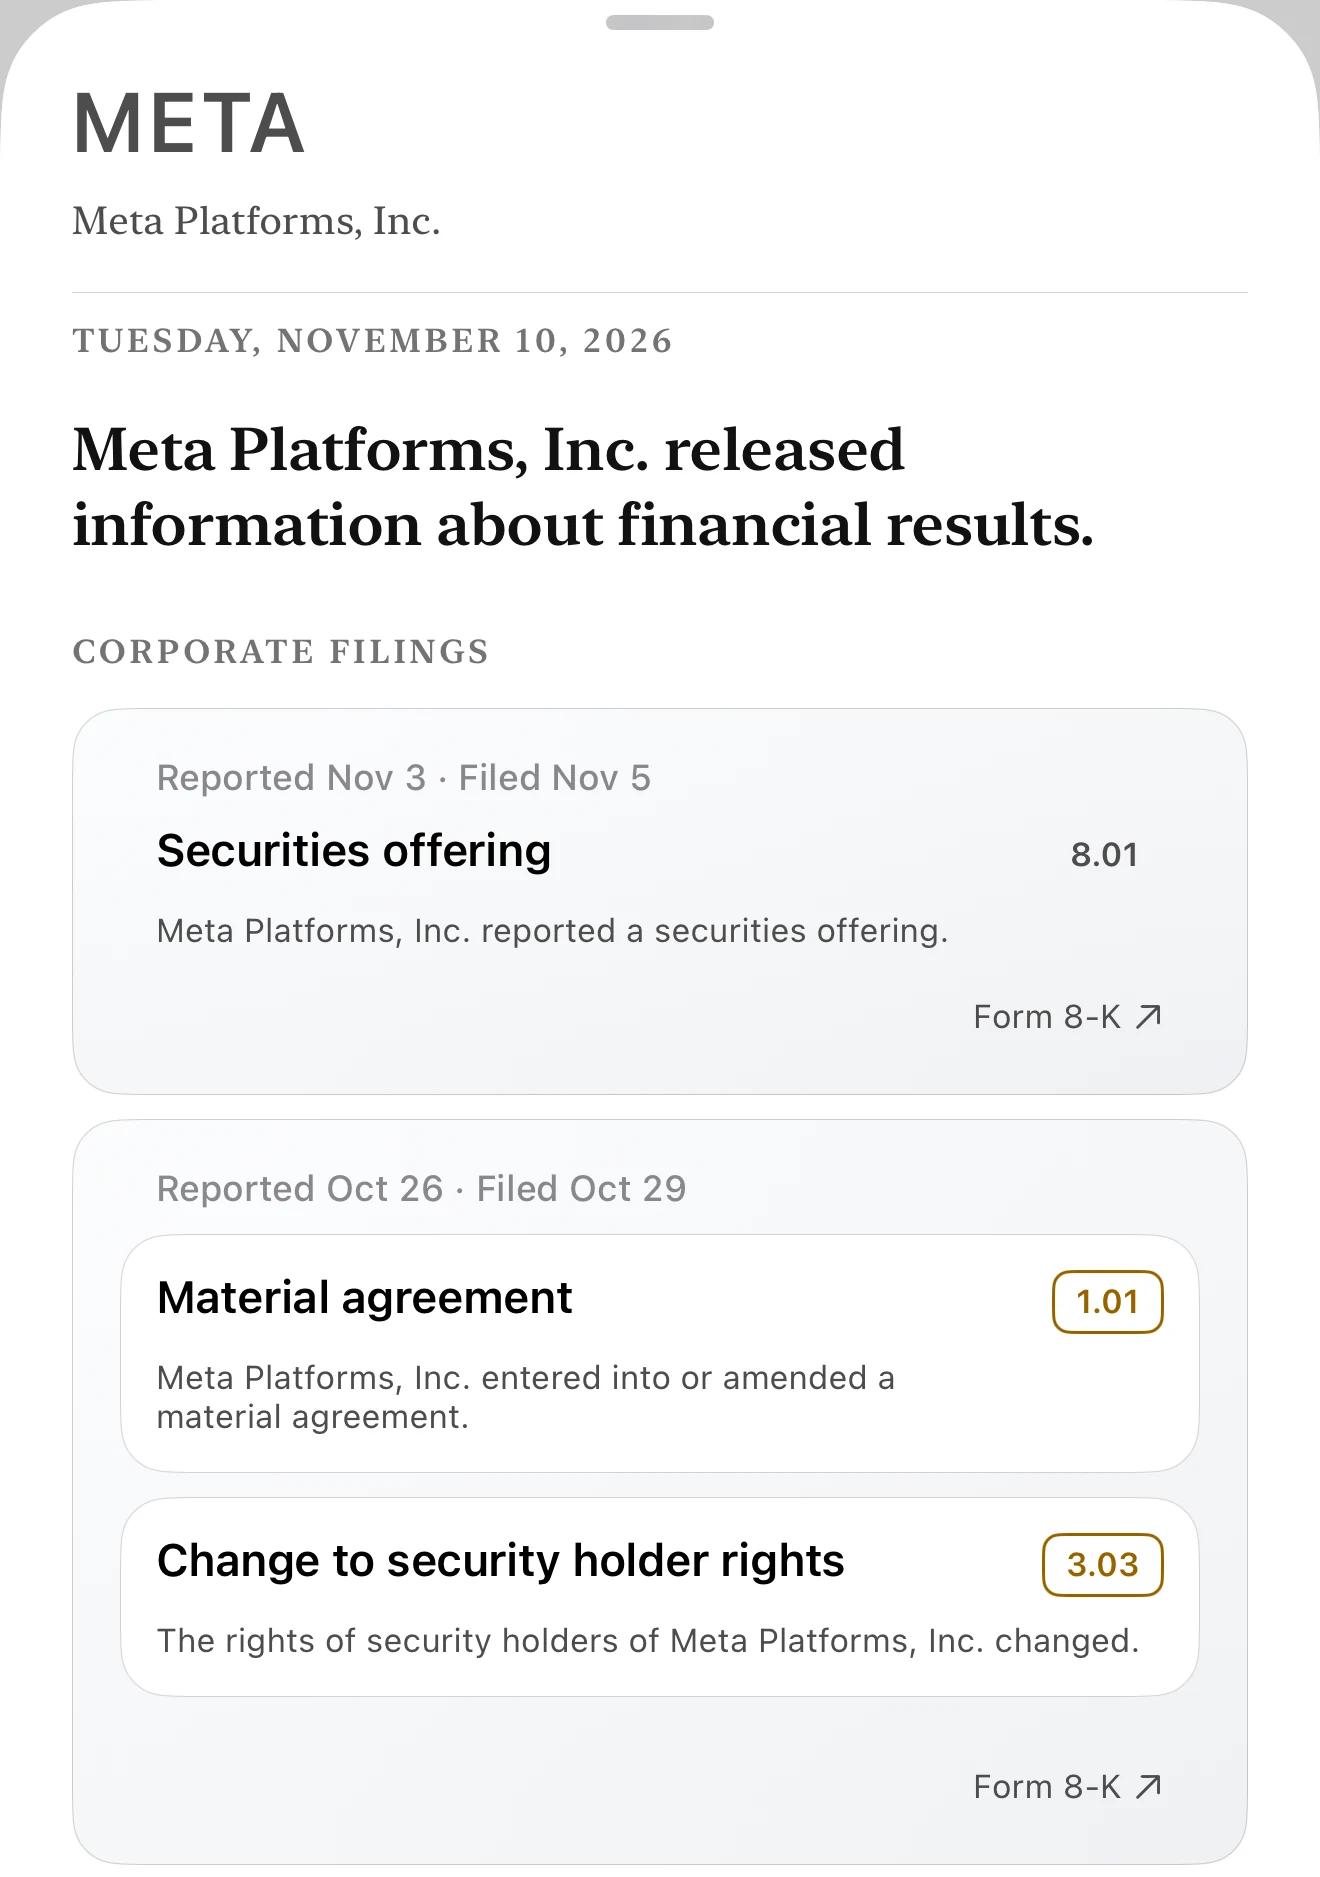
The company sheet
Disclosures from one company, on one sheet.
As filed
The full text, with exhibit tapouts to EDGAR.
Futures
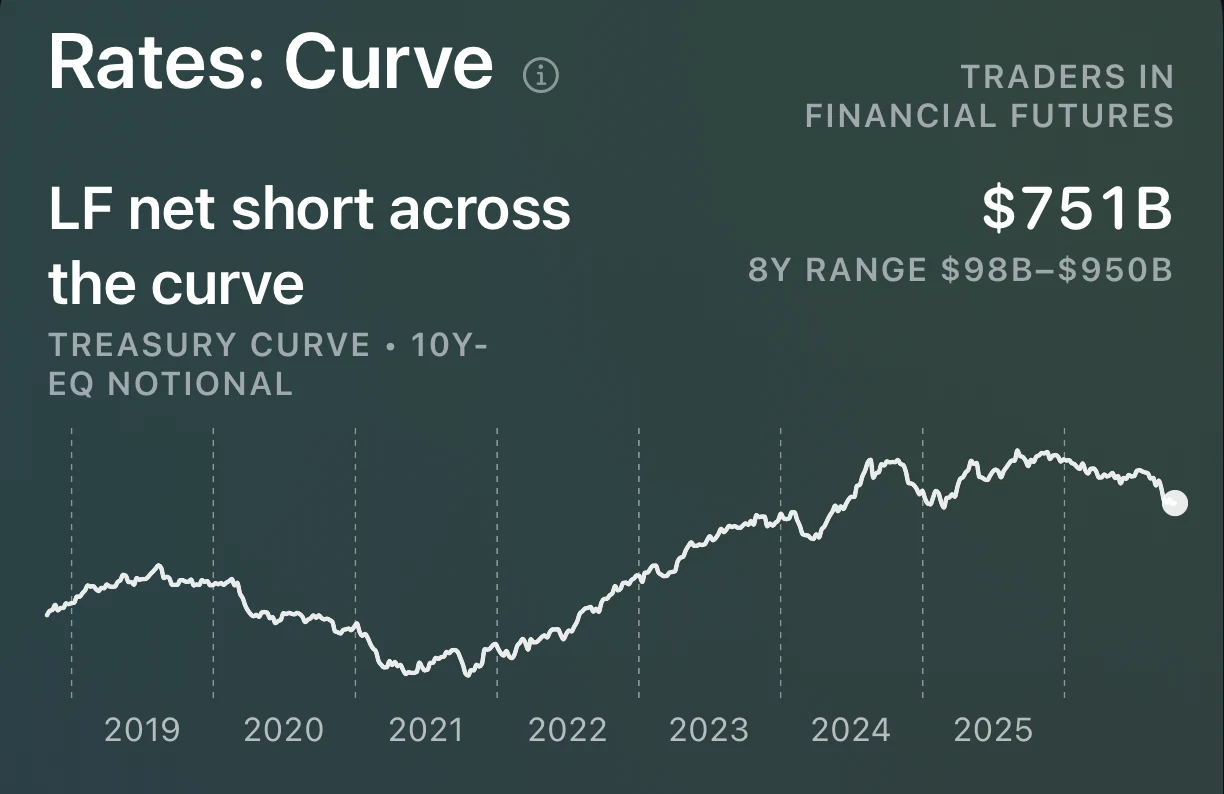
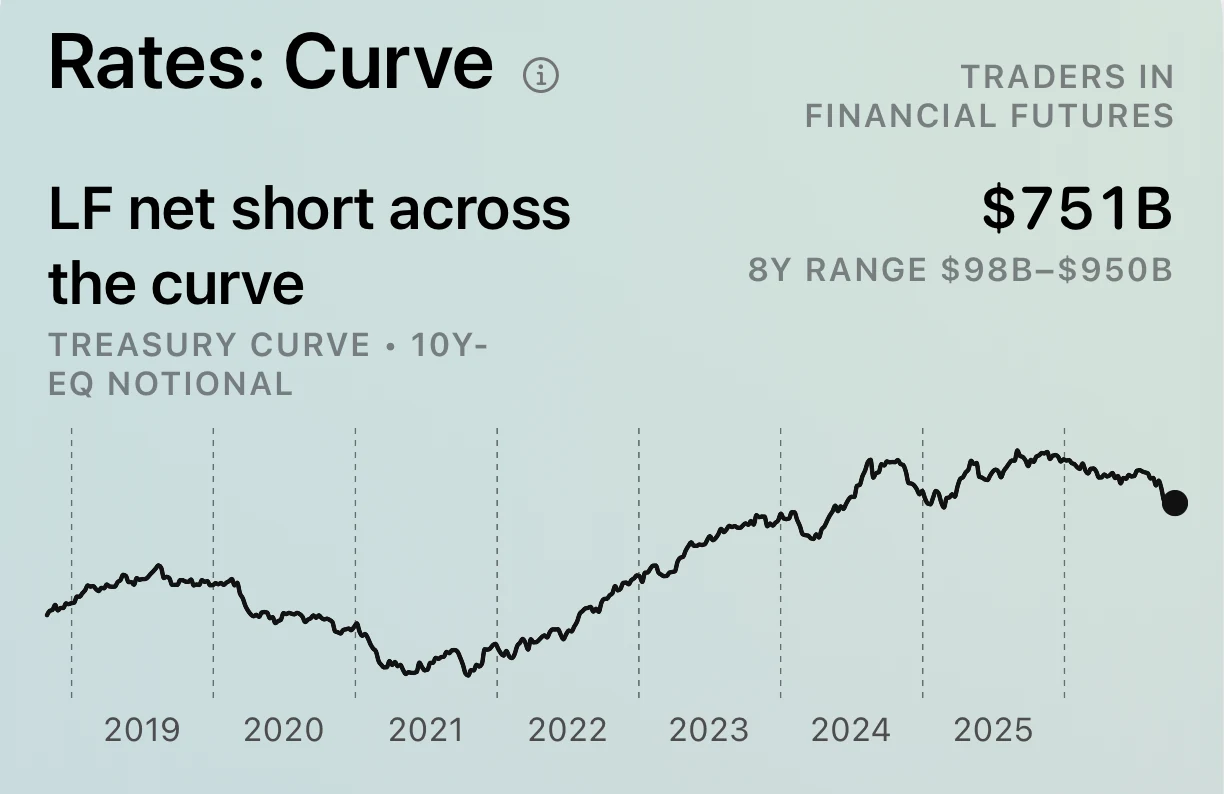
Check futures positioning across ten complexes.
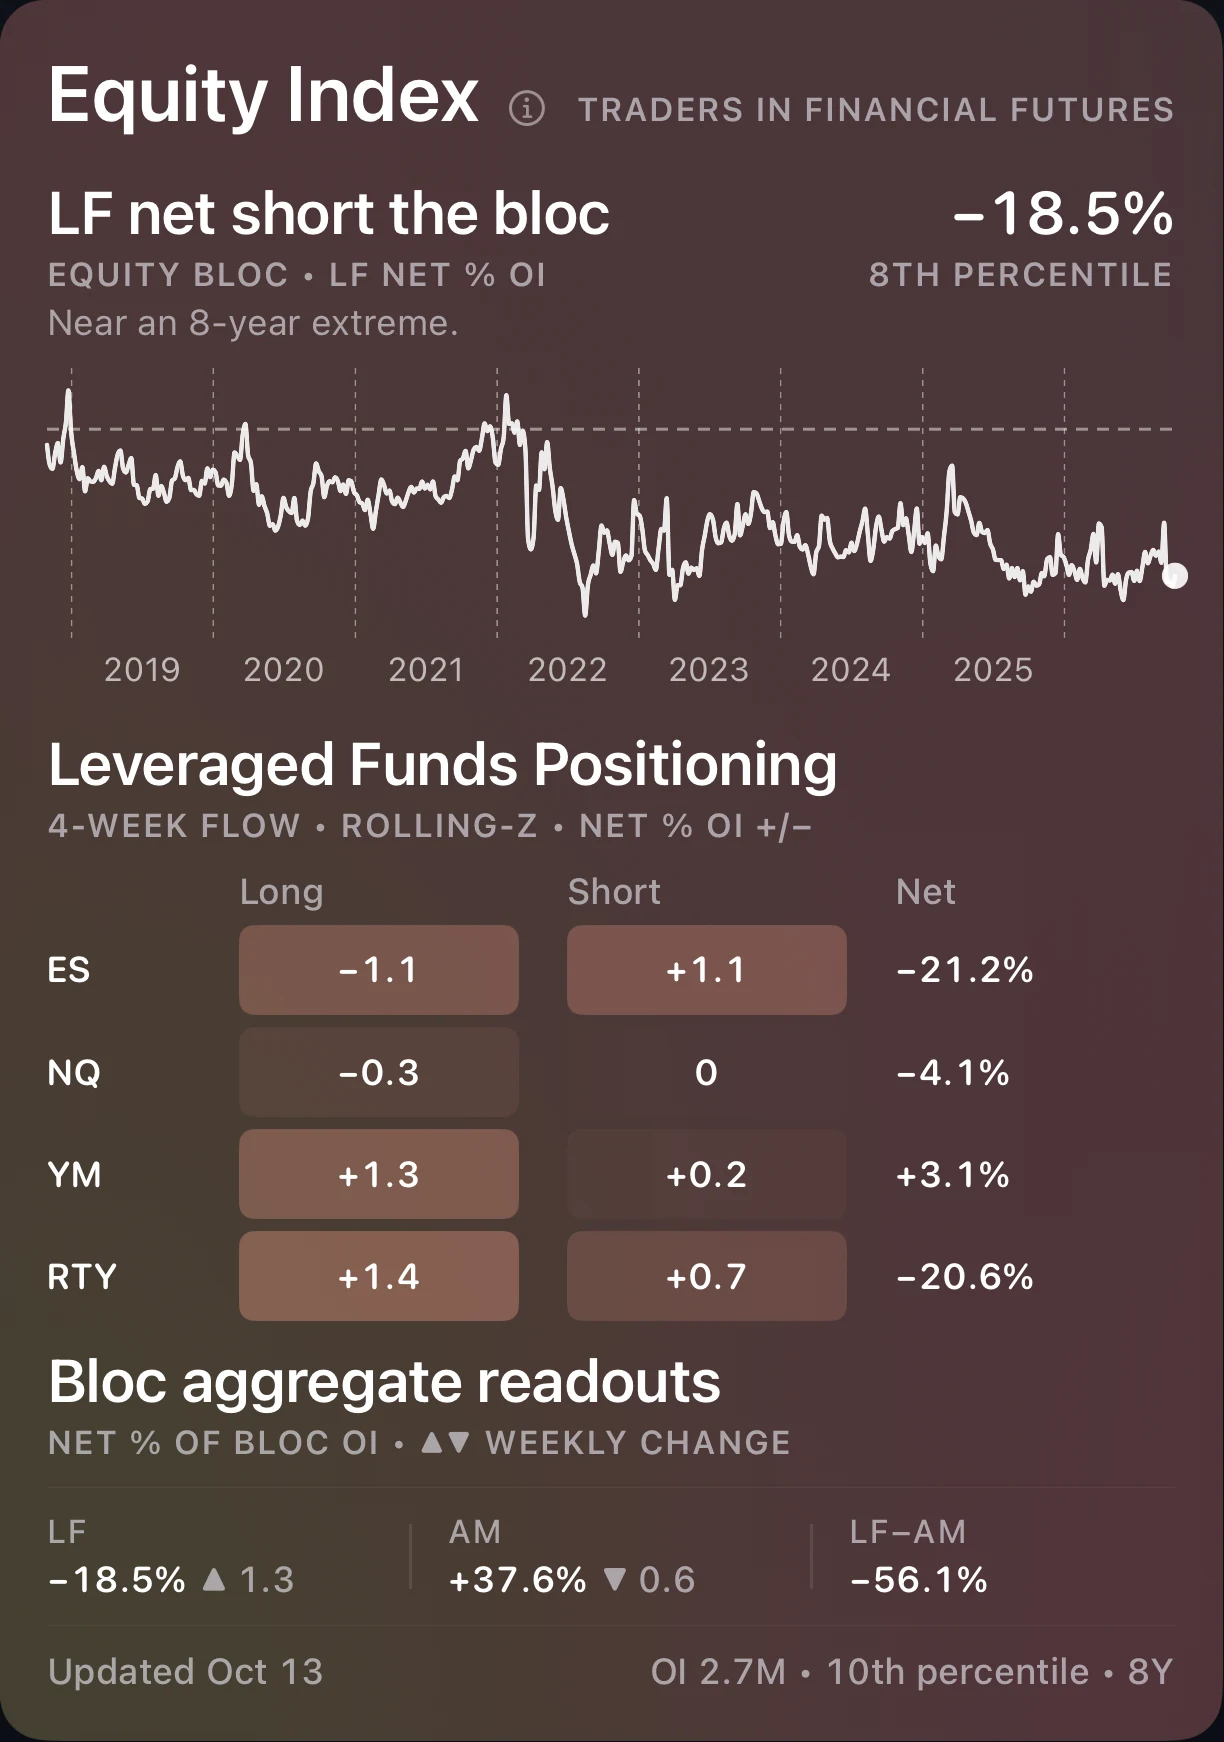
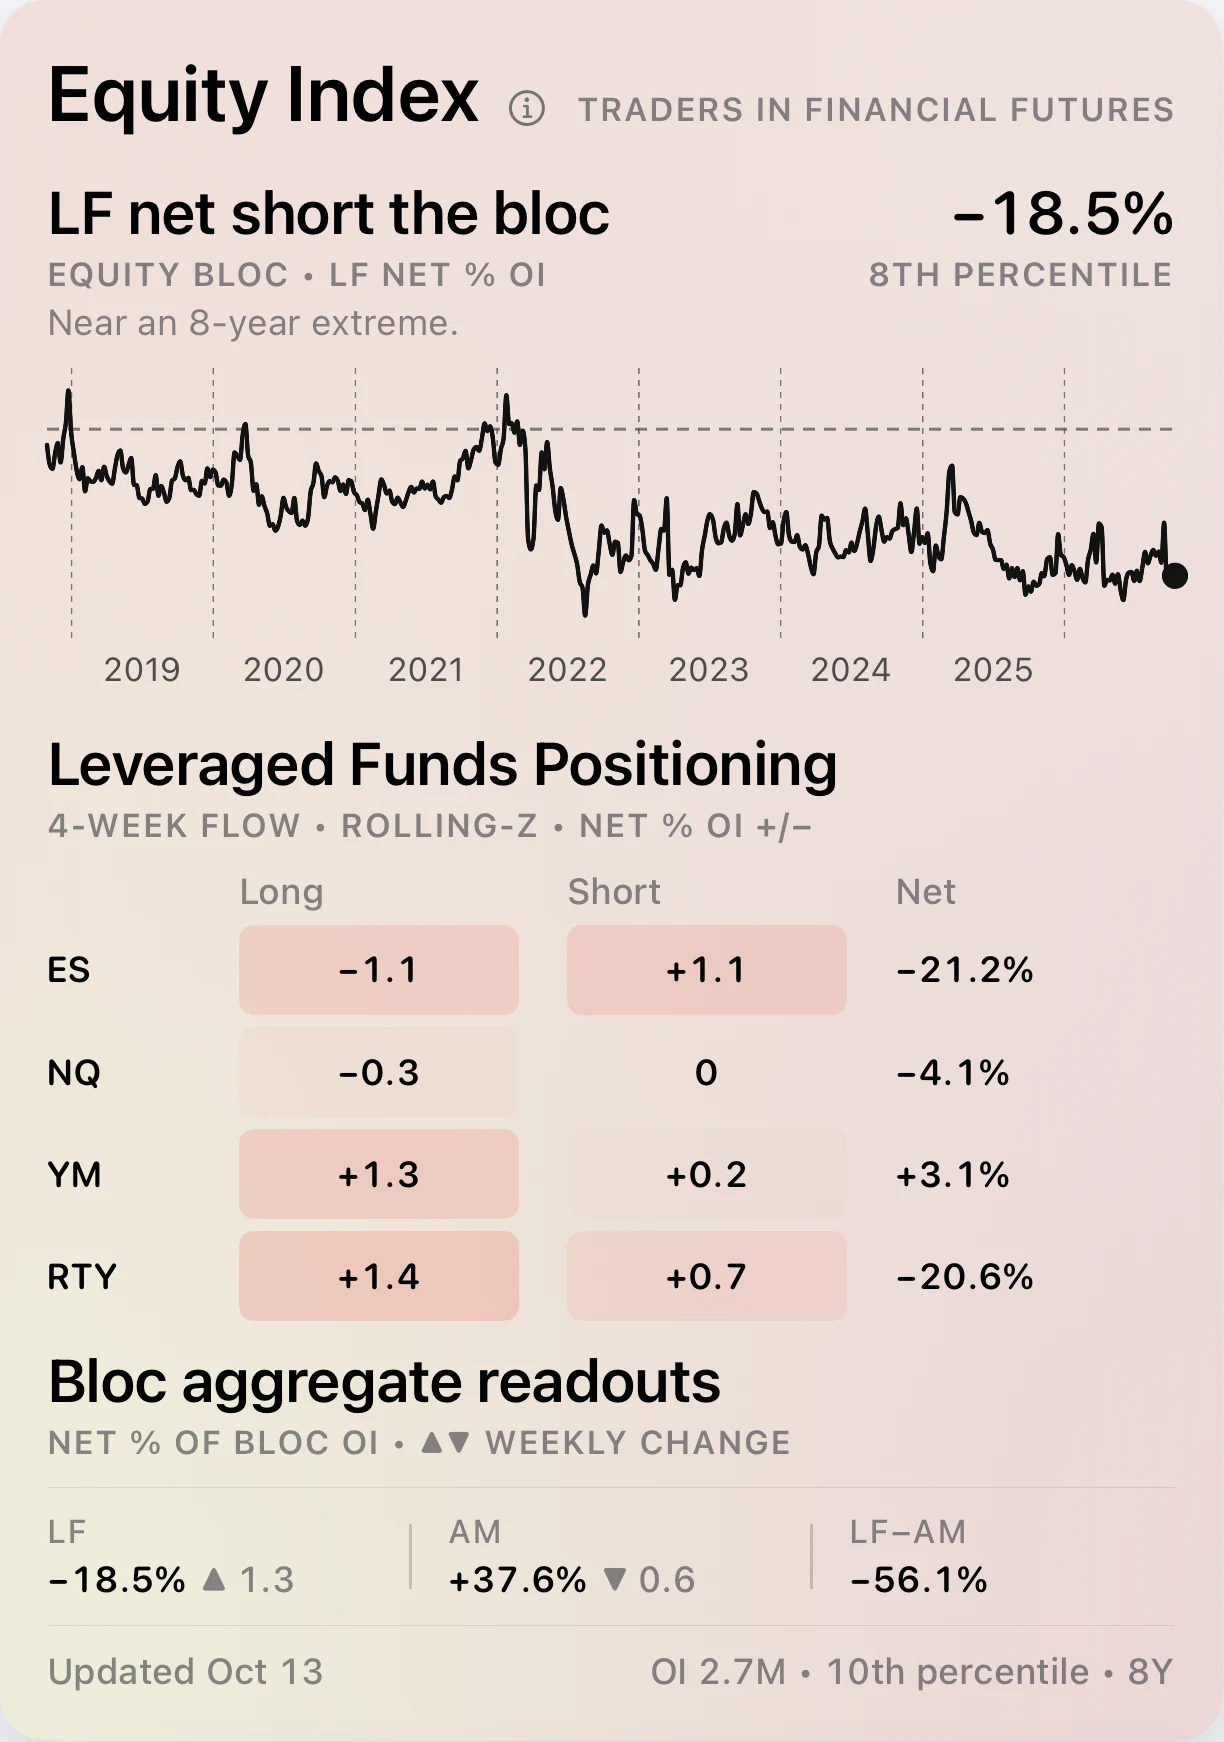
The CFTC reports futures positions each Friday, as held the Tuesday before. Each card charts positioning over time by trader category. The report covers the futures slice of each market.
The report
Each card names its complex, the CFTC report it draws on, and the date of the release.
The headline
Where positioning stands in the latest report, with the figure and its place in eight years.
The chart
The headline measure, week by week over eight years.
The breakdown
Positioning contract by contract, long, short and net, with totals by trader category.
Open interest
Open interest across the complex, with its percentile over eight years.
The explainer
The info button on each card names the trader categories and what each axis measures.
Settings
A few preferences shape how the app looks and how it reaches the record.
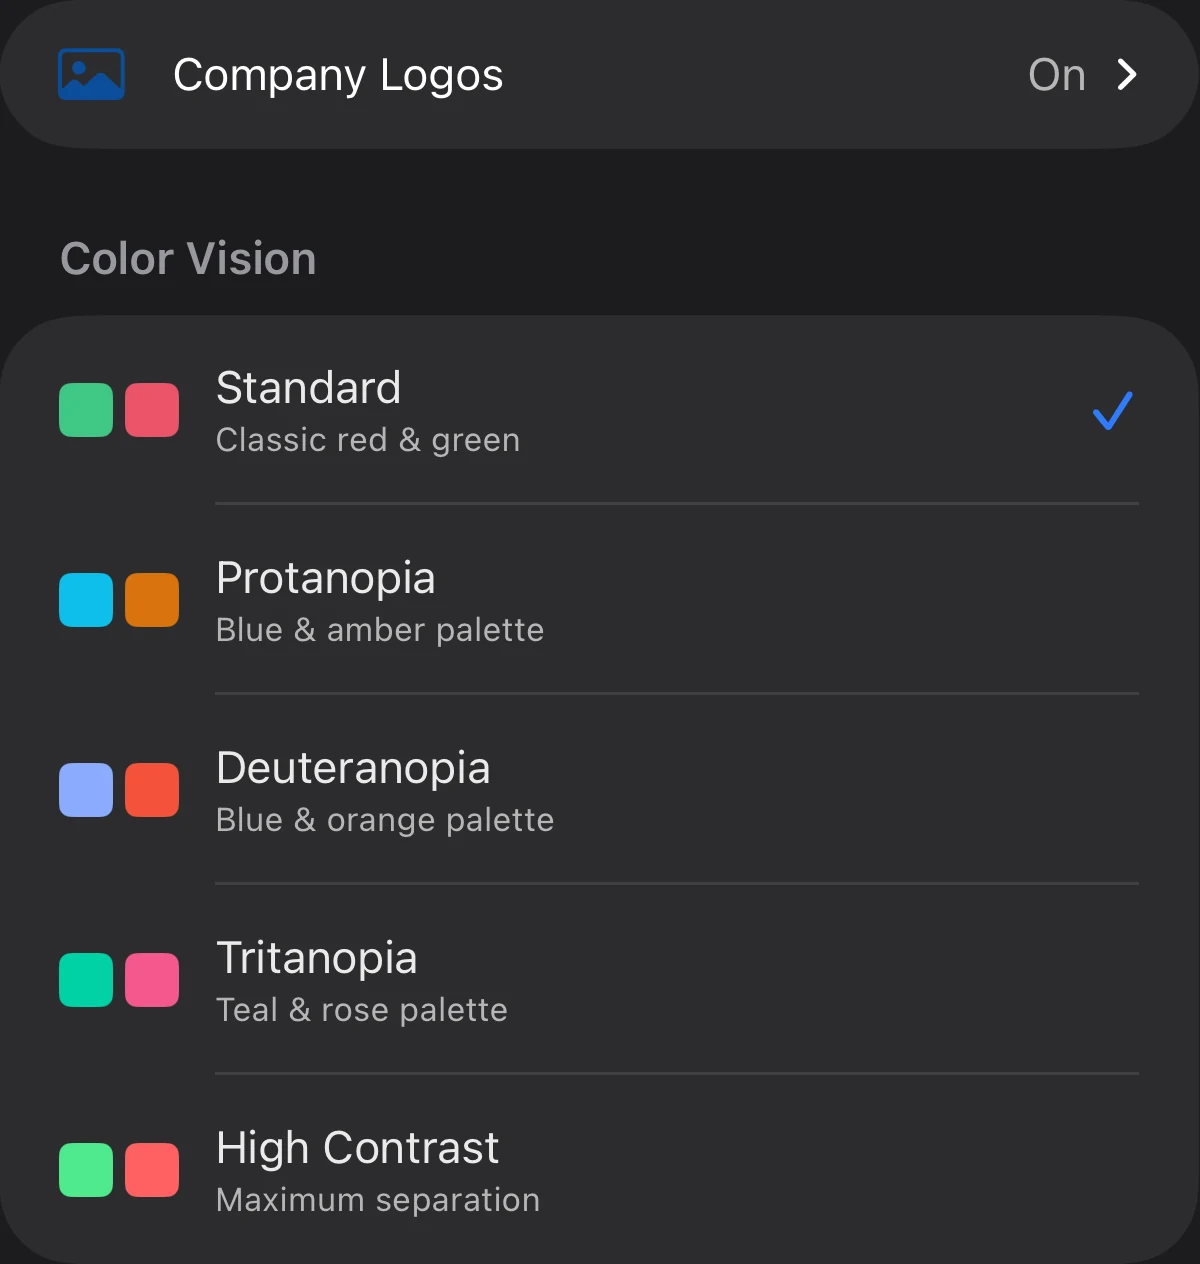
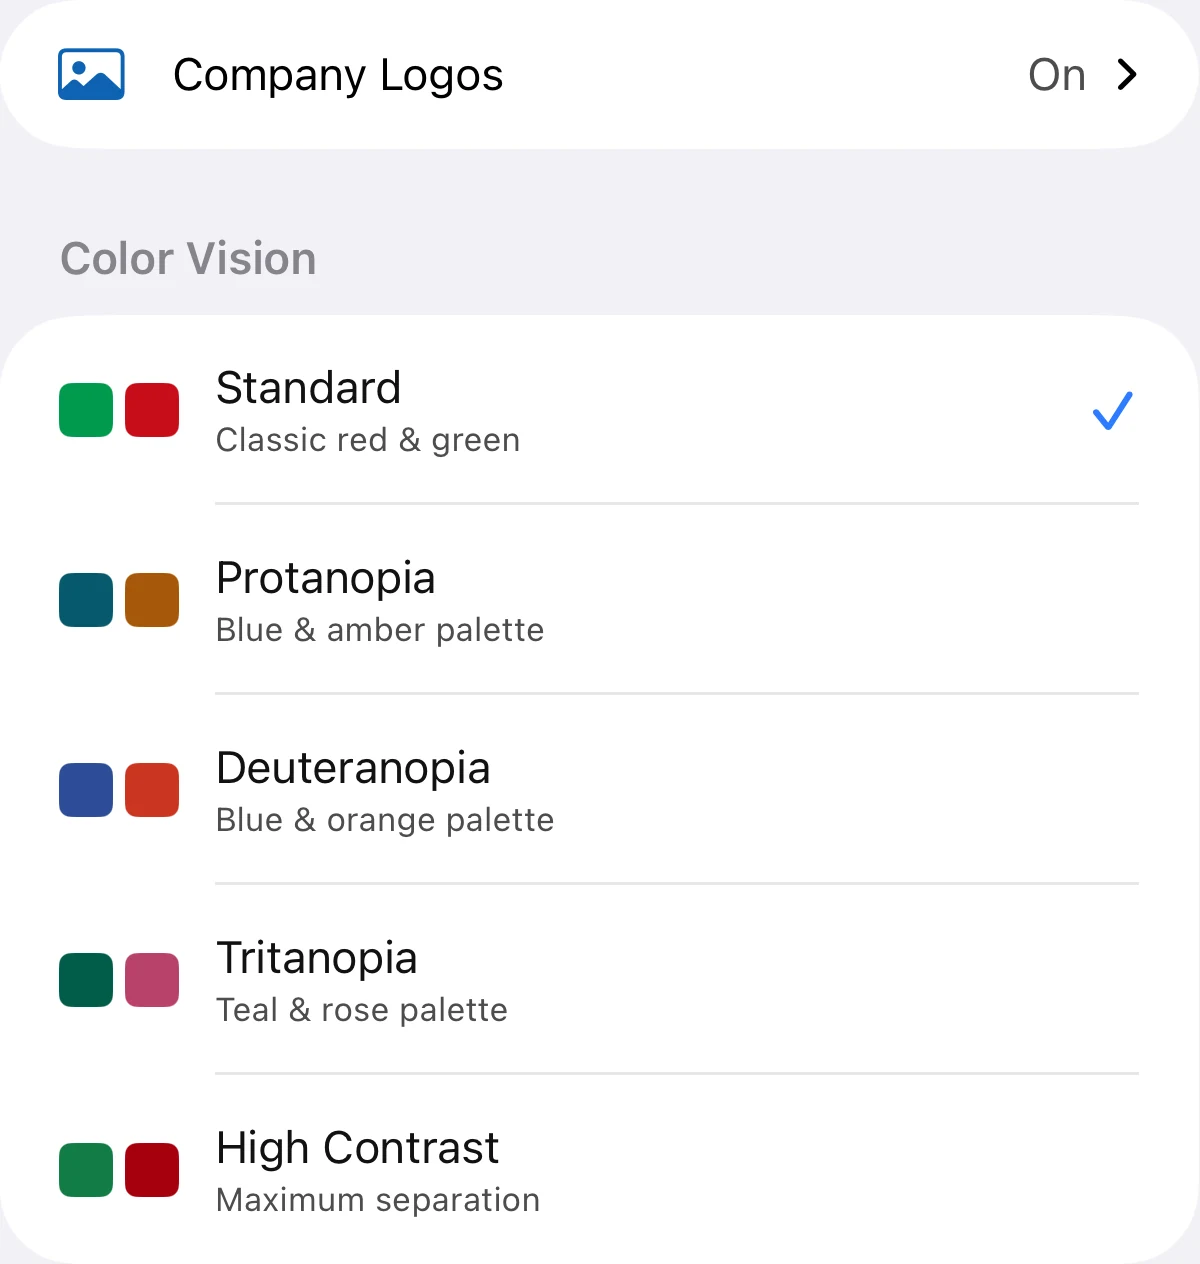
Color Vision
Five palettes to match how you see color: the standard red and green, three color-vision-safe pairs, and a high-contrast mode.
Company logos
Show the issuer’s logo beside each name, or switch logos off for a plainer list.
Network
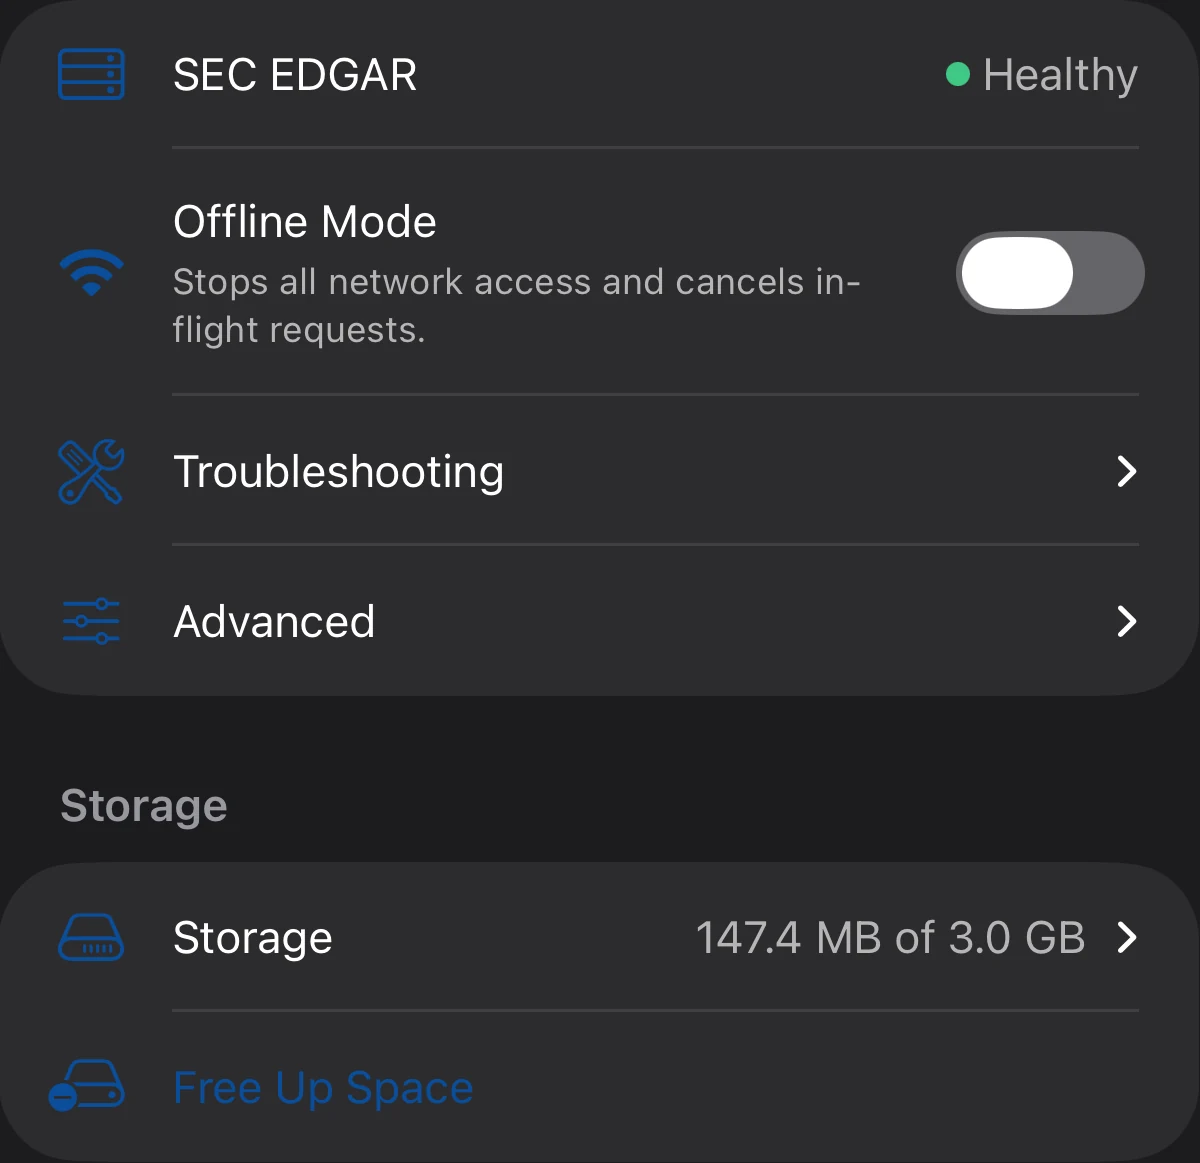
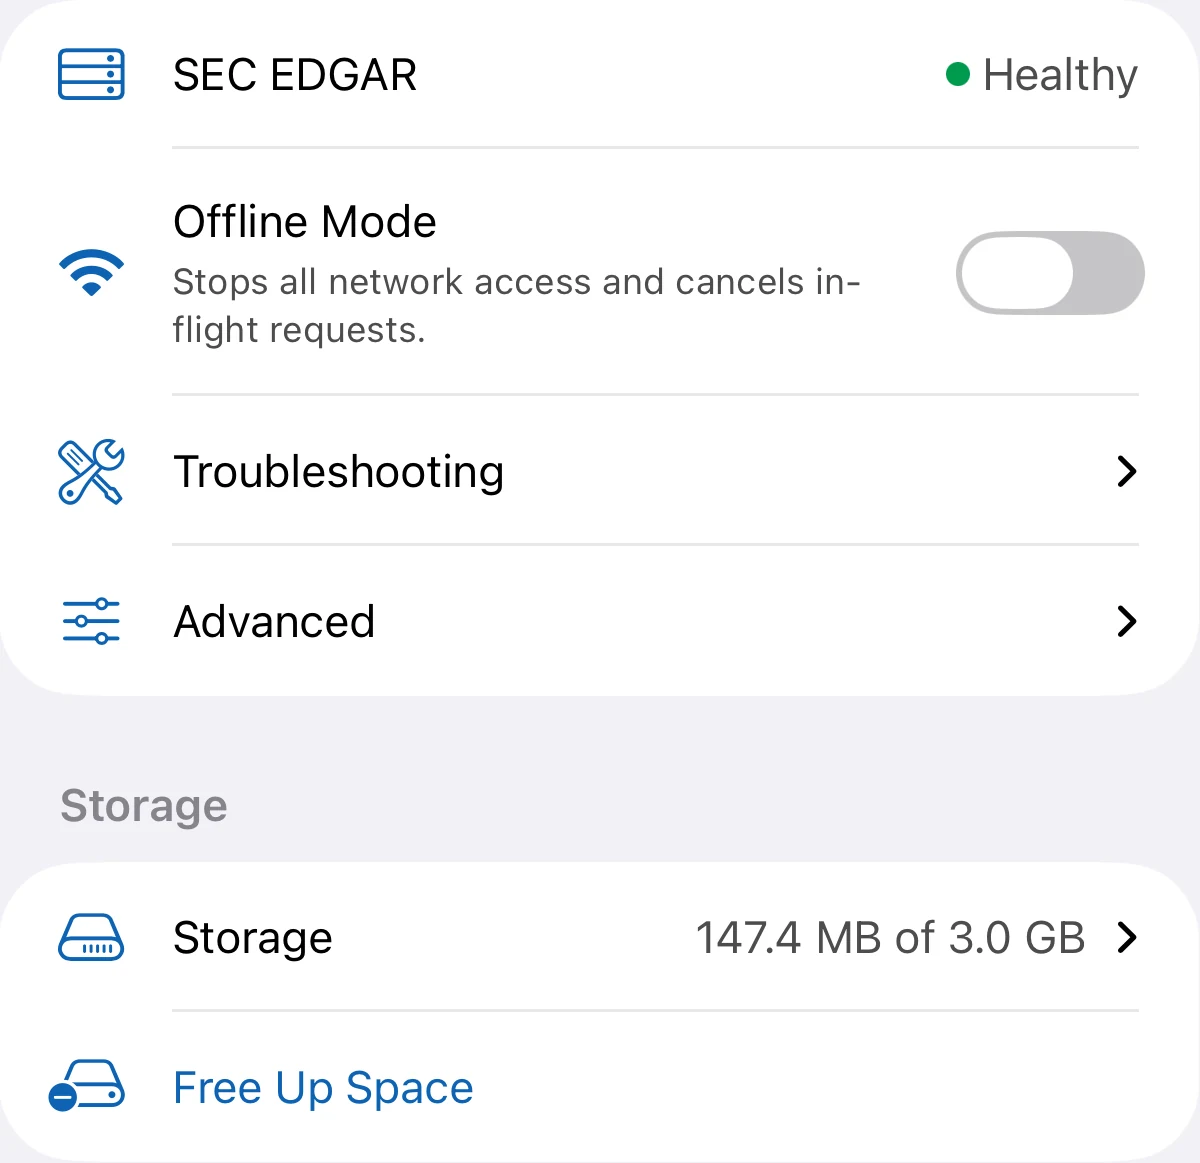
Check the SEC EDGAR connection’s health or switch to Offline Mode. Advanced controls set the download pacing.
Memory budget
Choose how much of the record the app keeps on the device.